Bitcoin has always been a market that tells stories through its charts. Every move, every pause, every breakout or breakdown carries the emotions of millions of participants around the world. Sometimes the signals are loud and obvious. Other times they appear quietly, hidden in the structure of price movements that only reveal their meaning after time passes.
Right now, Bitcoin seems to be drawing a pattern that many traders and analysts are beginning to notice.
The shape itself is not particularly rare. Markets form similar structures again and again. What makes this moment interesting is that the current pattern looks very similar to one that appeared before a significant correction in the past. When that earlier structure developed, Bitcoin eventually experienced a decline of roughly 30% before stabilizing again.
This does not mean history must repeat itself. Markets evolve, conditions change, and every cycle brings new factors into play. But when charts begin to echo previous formations, experienced observers pay attention.
The current structure began forming after the most recent drop in Bitcoin’s price. Instead of continuing downward immediately, the market slowed down. Price movements became less aggressive. Volatility began to contract. Instead of sharp candles, the chart started showing smaller movements and gradual upward drifting.
This type of structure often resembles what traders call a flag pattern.
A flag pattern usually appears after a strong move in one direction. The market pauses and begins moving slowly against the previous trend. On the surface, it can look like the start of a recovery. The chart becomes calmer. Buyers slowly step in. The atmosphere shifts from panic to cautious optimism.
But appearances can sometimes be misleading.
In many cases, this slow upward movement does not represent a true reversal. Instead, it can be a temporary stabilization phase where the market gathers liquidity before deciding its next major direction.
From a structural perspective, this makes sense. After a sharp decline, markets rarely move in a straight line. They need time to absorb selling pressure, redistribute positions, and allow new participants to enter the market.
During this phase, something interesting happens with liquidity.
Short-term traders often see the upward drift and assume the worst is over. They begin opening new long positions, expecting the recovery to continue. At the same time, traders who previously sold may place protective stop orders above the consolidation zone.
Meanwhile, below the current price range, another cluster of orders begins to form. Traders who entered during the rebound place their stop losses beneath support levels.
Over time, this creates pockets of liquidity both above and below the consolidation.
Markets tend to move toward areas where liquidity exists because those areas allow large positions to be filled more easily. This is why consolidation zones often become launch points for strong moves.
But the direction of that move depends on which side of the market ultimately gains control.
Psychology plays an enormous role during these periods.
When Bitcoin begins to bounce after a decline, the emotional atmosphere changes quickly. Fear slowly fades. Hope returns. Social media discussions become more optimistic. Traders start talking about the next rally.
Yet the market does not always reward optimism immediately.
For a true bullish reversal to occur, buyers must do more than simply slow down the decline. They must reclaim important resistance levels and hold those levels with strong momentum. Without that confirmation, rebounds can remain fragile.
Right now, Bitcoin appears to be standing at exactly that kind of crossroads.
If buyers manage to push the price above the upper boundary of the current flag-like structure and maintain strength, the bearish implications of the pattern would weaken significantly. A sustained breakout could shift sentiment back toward recovery and potentially attract fresh capital into the market.
But if the structure continues to develop without a strong breakout, the possibility remains that the market is simply pausing before another volatile phase.
This uncertainty is what makes the current moment so fascinating.
Bitcoin has always been a market driven by both emotion and structure. Charts reflect the collective behavior of millions of traders making decisions under uncertainty. Patterns emerge not because they are magical, but because human behavior often repeats itself.
Fear leads to selling.
Hope leads to buying.
And periods of calm often appear just before major decisions.
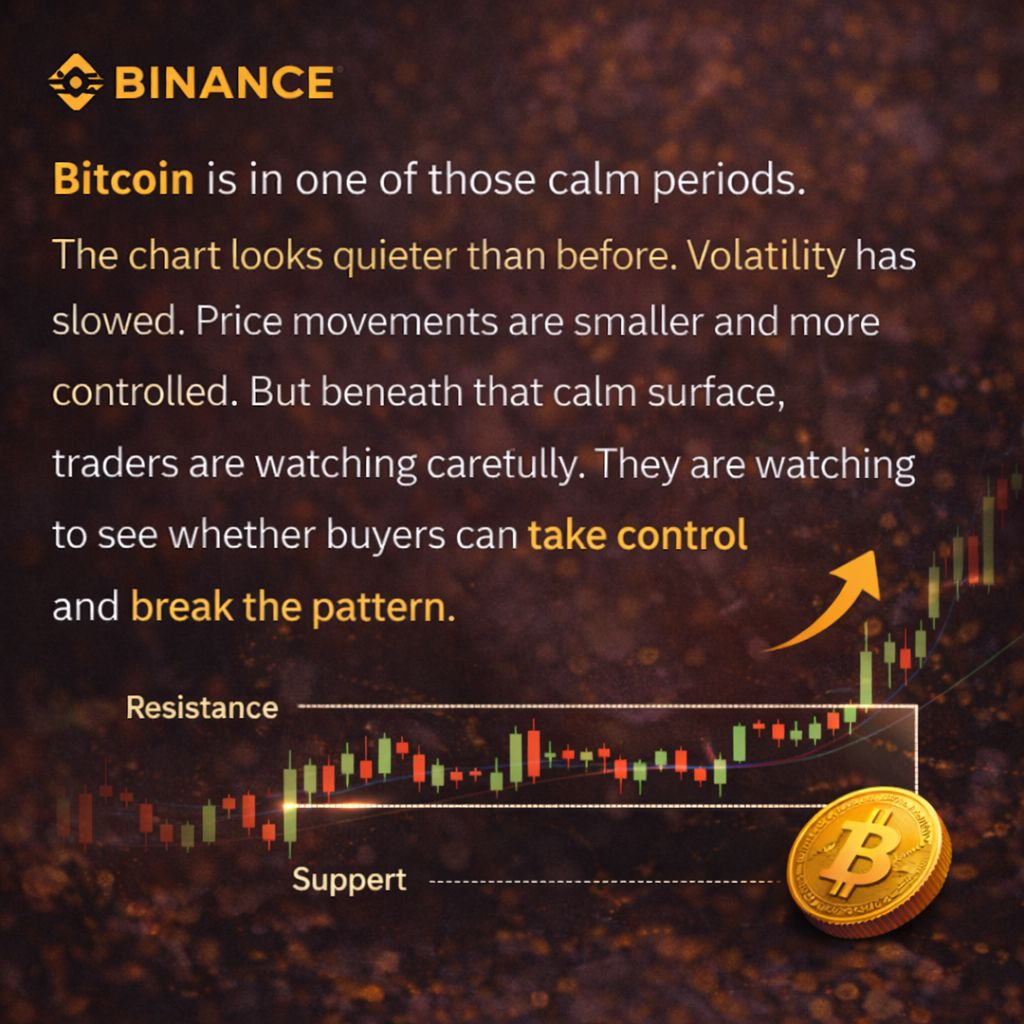
At the moment, Bitcoin is in one of those calm periods.
The chart looks quieter than before. Volatility has slowed. Price movements are smaller and more controlled. But beneath that calm surface, traders are watching carefully.
They are watching to see whether buyers can take control and break the pattern.
They are watching to see whether support levels continue to hold.
And they are watching to see whether the market chooses stability or volatility as its next path.
No one can predict the future with certainty. Markets remain unpredictable by nature. But patterns like this remind us that the most important moments often arrive when things seem quiet.
Because sometimes the market is not resting.
Sometimes it is simply deciding what to do next.


