As of March 7, 2026, $SXP is trading at approximately $0.0221 USD, reflecting a 7.53% decline over the past 24 hours. The weekly performance shows a gain of 7.25%, but the monthly change is down 29.07%, indicating ongoing volatility in a broader downtrend. The market cap stands around $13.6 million to $16.8 million, with 24-hour trading volume between $0.58 million and $17.9 million across sources. The circulating supply is about 673 million SXP.
Key recent developments include:
Delisting from major South Korean exchanges (Upbit, Bithumb, Coinone) on February 10, 2026, due to unresolved transparency and disclosure issues, which halted trading and likely contributed to price pressure.
An earlier upgrade announcement in October 2025 for Core 5.0 and Card V3, shifting to a new architecture with features like IBAN accounts, as part of the project's pivot to the Solar Network.
Migration of the Swipechain blockchain to a community-controlled DAO under the Solar name, ongoing as of recent reports.
A short-term surge of 6.12% in just 15 minutes reported about 18 hours ago, pushing the price temporarily to $0.0208 amid increased trading activity, though this was followed by the recent dip.
The project, originally Swipe and rebranded to Solar, focuses on blockchain-based financial services but has faced significant challenges, including a 89.22% drop over the past year and a 99.07% decline over five years.
Candlestick Chart Analysis
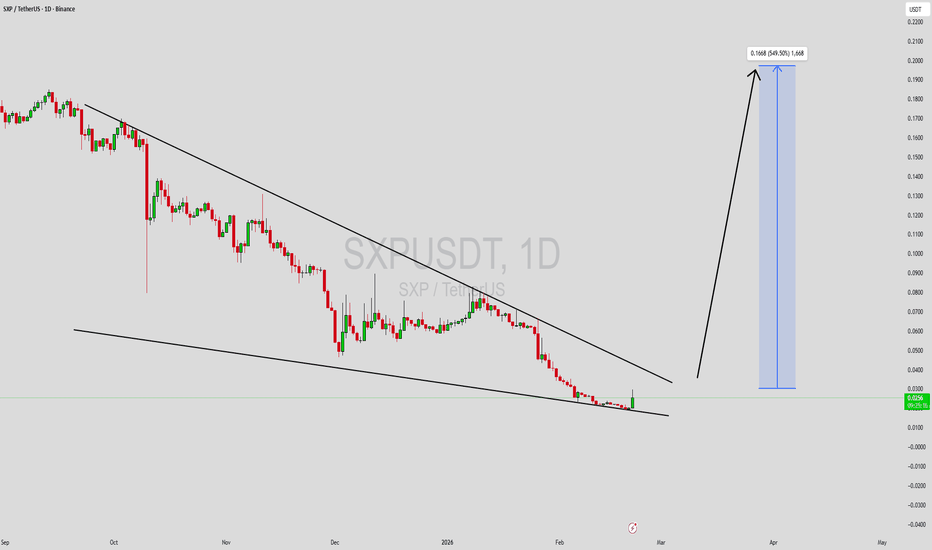
@SxP /USDT is in a pronounced long-term downtrend, with the price dropping from highs around $0.30 in late 2025 to current lows near $0.022. This represents a steep decline, with the asset hitting an all-time low of $0.0186 in February 2026. Technical indicators suggest neutral to bearish momentum, with no strong buy signals emerging yet.
Recent Candlestick Patterns (Daily Timeframe, Last 5-10 Candles)
Based on available chart data, the last few daily candles show strong selling pressure:
Predominantly bearish candles with large red bodies, indicating closes lower than opens and continued downward momentum.
Volatility is evident, with intraday ranges suggesting wicks on candles (e.g., lower wicks showing brief rebounds from daily lows).
No clear reversal patterns like hammers or dojis in the immediate recent candles; instead, the pattern aligns with continuation of the downtrend, potentially forming bearish engulfing or descending three methods in clusters.
The most recent candle (as of the latest data) opened at $0.0238, ranged from $0.0221 to $0.0244, and closed lower, reinforcing the 7.53% drop.
Key Levels and Trends
Support: Immediate at $0.0221 (recent daily low); deeper historical support near $0.0186 (all-time low).
Resistance: $0.0244 (recent high); minor at $0.0238 (recent open). Breaking above could signal short-term recovery.
Trend: Strong downtrend over months, with lower highs and lows. Weekly gains provide some counter, but monthly losses dominate. No uptrend or sideways consolidation; price action remains bearish overall.
Indicators:
Moving Averages: Neutral, with price below key MAs (e.g., MA100 acting as resistance in shorter timeframes).
RSI: Trending downward, approaching oversold levels (around 30-40), suggesting potential exhaustion but no confirmed rebound.
MACD: Not detailed, but aligned with neutral oscillators.
Volume: Moderate at 21.27 million SXP recently, increasing on down moves, which supports bearish sentiment.
Overall market sentiment is bearish, driven by long-term declines and recent news like delistings. However, neutral indicators and occasional short surges hint at possible short-term bounces if support holds. For visual reference, here's a recent 1-hour chart showing a descending channel breakout attempt and RSI decline:
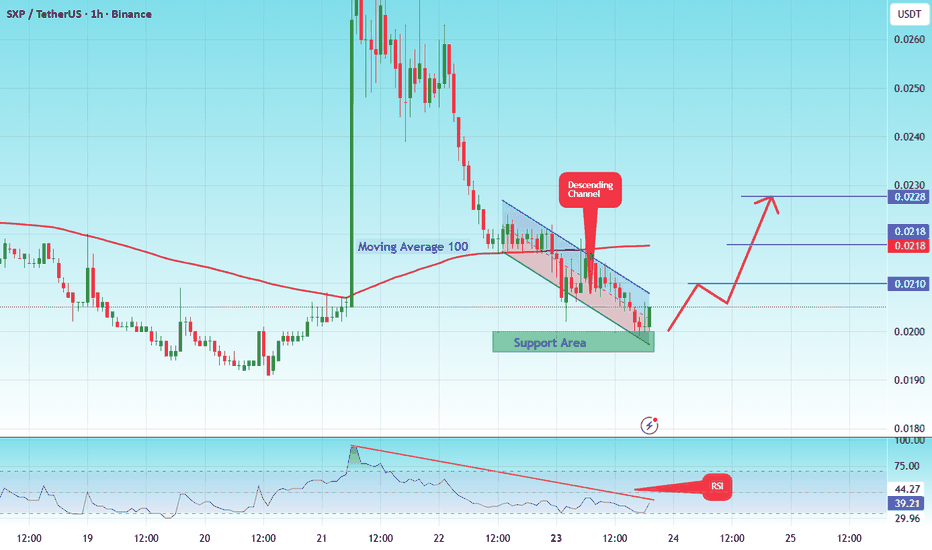
SXP / TetherUS Trade Ideas — BINANCE:SXPUSDT — TradingView
And a daily chart illustrating the extended downtrend with a potential reversal arrow:
SXP / TetherUS Trade Ideas — BINANCE:SXPUSDT — TradingView
This analysis is based on current data; crypto markets are highly volatile, so monitor for updates.