$VET USDT Approaching Demand Zone – Massive Rebound Potential?
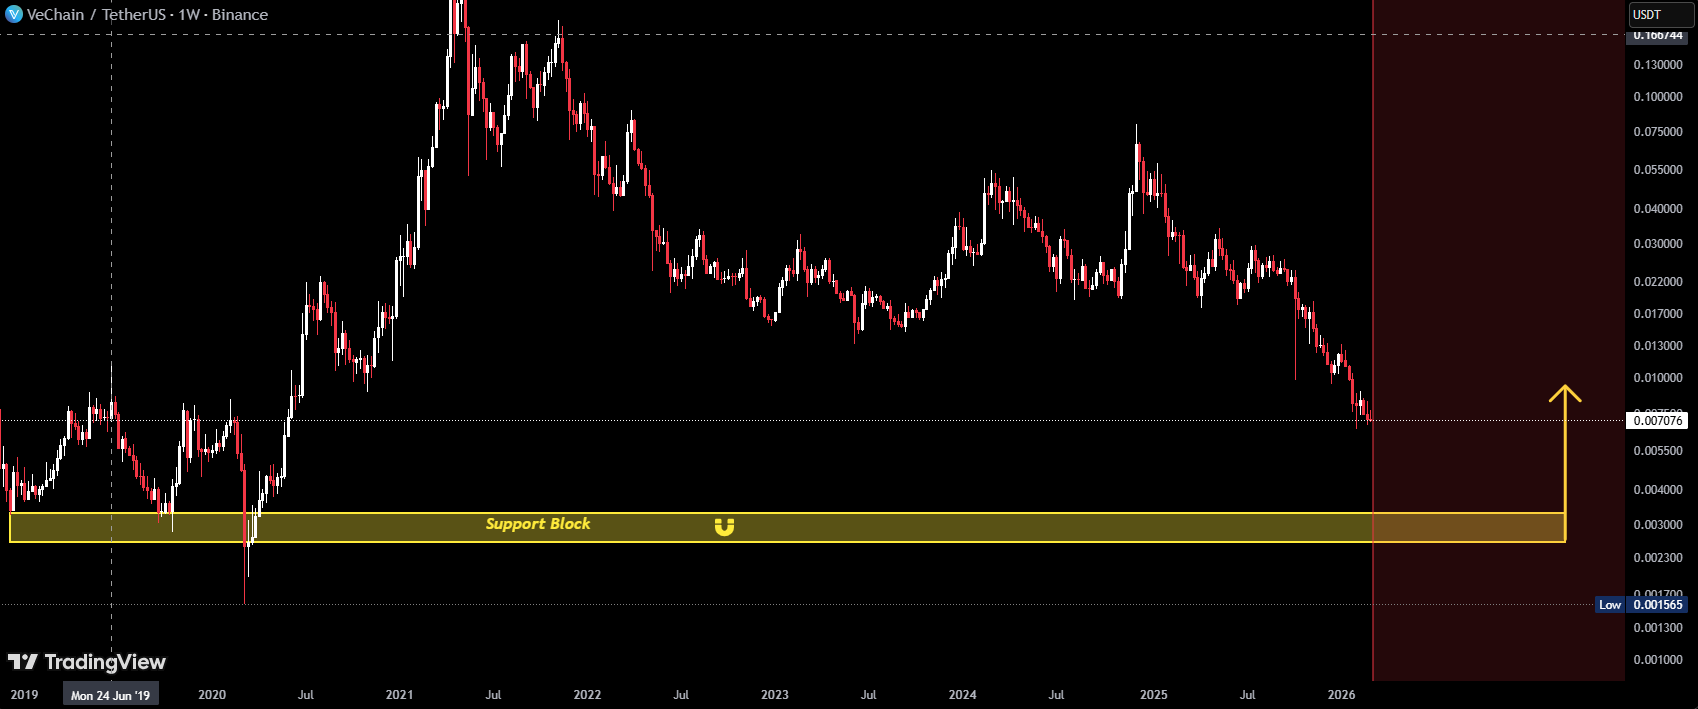
The $VET /USDT weekly chart shows a long-term downtrend after reaching its bull market peak in 2021. Since then, price has formed a series of Lower Highs and Lower Lows, indicating bearish dominance on the higher timeframe.
Currently, the price is trading around $0.007, approaching a very strong macro support zone that previously acted as a major accumulation area during 2019–2020.
The zone marked by the yellow block ($0.0033 – $0.0026) represents a major demand zone / support block, which historically triggered a massive rally of more than 1000% in the previous market cycle.
If price revisits this area, there is a strong possibility of a significant price reaction, either in the form of a strong rebound or a further breakdown.
---
Chart Structure Pattern
The market structure on this chart reveals several important patterns:
1. Macro Downtrend Structure
A clear sequence of Lower Highs and Lower Lows has been forming since 2021.
This indicates that selling pressure still dominates the long-term trend.
2. Distribution Phase
The period between 2023–2025 shows a distribution and consolidation phase before the price continued its downward movement.
3. Major Demand Zone
The $0.0033 – $0.0026 area represents a historical accumulation zone that previously triggered a massive bull run.
This zone could act as the last line of defense for the long-term bullish structure.
---
Key Levels
Major Support
$0.0033
$0.0026 (major macro support)
Important Resistance
$0.012
$0.017
$0.025
$0.040
---
Bullish Scenario
A bullish scenario could occur if price reaches the $0.0033 – $0.0026 support zone and strong buyer reactions appear.
Possible developments include:
1. A strong bounce from the demand zone.
2. Price begins forming higher lows on lower timeframes.
3. A breakout above the $0.012 – $0.017 resistance area.
If bullish momentum develops, the next potential targets could be:
$0.017
$0.025
$0.040
In this scenario, the yellow zone could become a major accumulation area before the next bull market cycle.
---
Bearish Scenario
A bearish scenario occurs if price fails to hold the demand zone.
Bearish confirmations include:
1. A strong breakdown below $0.0026.
2. A weekly candle close below the support zone.
3. A significant increase in selling volume.
If this happens, price may enter downside price discovery, with potential targets around:
$0.0020
$0.0015
These levels could become the next historical support areas on the macro chart.
---
Conclusion
$VET is currently in a decline phase toward a very important macro support zone. The $0.0033 – $0.0026 area will be a crucial level that may determine the next major market direction.
If this zone holds, there is a strong possibility of a large rebound and a long-term accumulation phase. However, if the support breaks, the market could continue into a deeper bearish phase before finding a new equilibrium.
Therefore, this zone becomes a critical area to monitor for both traders and long-term investors.
#VET #BullishMomentum #TrendingTopic
