
In a detailed analysis shared by Coinbase Institutional, Bitcoin's ongoing price correction has been characterized as a “critical base-building period” that could ultimately set the stage for the next phase of growth in the cryptocurrency market.
The report, published on March 6, highlights mounting stress across the ecosystem—including rising unrealized losses, miner profitability pressure, and liquidity strains—while emphasizing that the market may need an internal crypto catalyst to drive a sustainable recovery.
Currently, Bitcoin is trading around $68,000, significantly below its prior highs above $125,000, reflecting a broader shift in market sentiment over the past several months.
Market Sentiment Falls Into “Fear Territory”
According to data from Glassnode, Bitcoin’s entity-adjusted Net Unrealized Profit/Loss (NUPL) metric has slipped below zero, entering what analysts call the “fear zone.”
Historically, this region indicates that a large portion of market participants are holding coins at unrealized losses, which often corresponds with periods of:
Market anxiety
Capitulation-driven selling
Long-term accumulation opportunities
Coinbase’s analysis also highlights a key pressure point: Bitcoin’s spot price is now trading below the estimated average miner production cost of roughly $88,000.
When this occurs, miners can face profitability stress, which may force some operators to sell reserves or reduce operations—adding short-term volatility to the market.
 Source: @CoinbaseInsto (X)
Liquidity Strains and Mining Pressures
Recent industry developments have further intensified market stress.
One notable event involved BlockFills temporarily suspending deposits and withdrawals, citing operational challenges. While temporary, the move reflected wider liquidity pressures within certain parts of the crypto ecosystem.
Meanwhile, severe winter weather conditions across the United States disrupted mining operations, forcing several miners offline and contributing to a noticeable decline in network hashrate.
This disruption triggered a mining difficulty adjustment, which may actually help stabilize the sector in the near term.
Key factors Coinbase Institutional is monitoring include:
Mining Difficulty ResetThe recent drop in network difficulty could ease pressure on miners by lowering the computational cost required to produce new blocks.
Long-Term Holder ActivityAlthough long-term holders reduced their positions during Q4 2025, centralized exchanges still recorded net Bitcoin outflows, suggesting that coins continue to move into longer-term storage.
Coinbase analysts also noted that exchange flows appear to correlate more strongly with macroeconomic signals, such as changes in the U.S. 10-year breakeven inflation rate, rather than long-term holder activity alone.
Market Volatility and Liquidations
The report comes after a particularly volatile week for Bitcoin.
Currently, $BTC fell more than 4% within 24 hours, dropping to roughly $67,976 amid $247.53 million in liquidations over the same period, according to Coinglass. Much of the downside pressure came from leveraged traders being forced out of their positions on major derivatives platforms such as Binance.
 Source: Coinmarketcap
Large long liquidations often accelerate price drops during corrections, but they can also reset excessive leverage, creating healthier conditions for the next move.
What’s Next for Bitcoin?
A technical fractal chart shared by analyst Alien OPS suggests that Bitcoin may be following a familiar market structure seen in previous cycles—one that could involve a short-term pullback before a much larger upside move.
The chart compares two similar price structures. In the earlier setup, Bitcoin formed a local lower high after a rebound, followed by a brief correction before launching into a powerful rally that pushed prices significantly higher.
A similar pattern appears to be forming in the current market structure.
After topping near the $95K–$100K region, Bitcoin experienced a sharp decline toward the $60K area, where buyers stepped in aggressively. The recent rebound toward the $68K–$70K range now appears to be forming a temporary resistance zone, similar to the structure shown in the historical fractal.
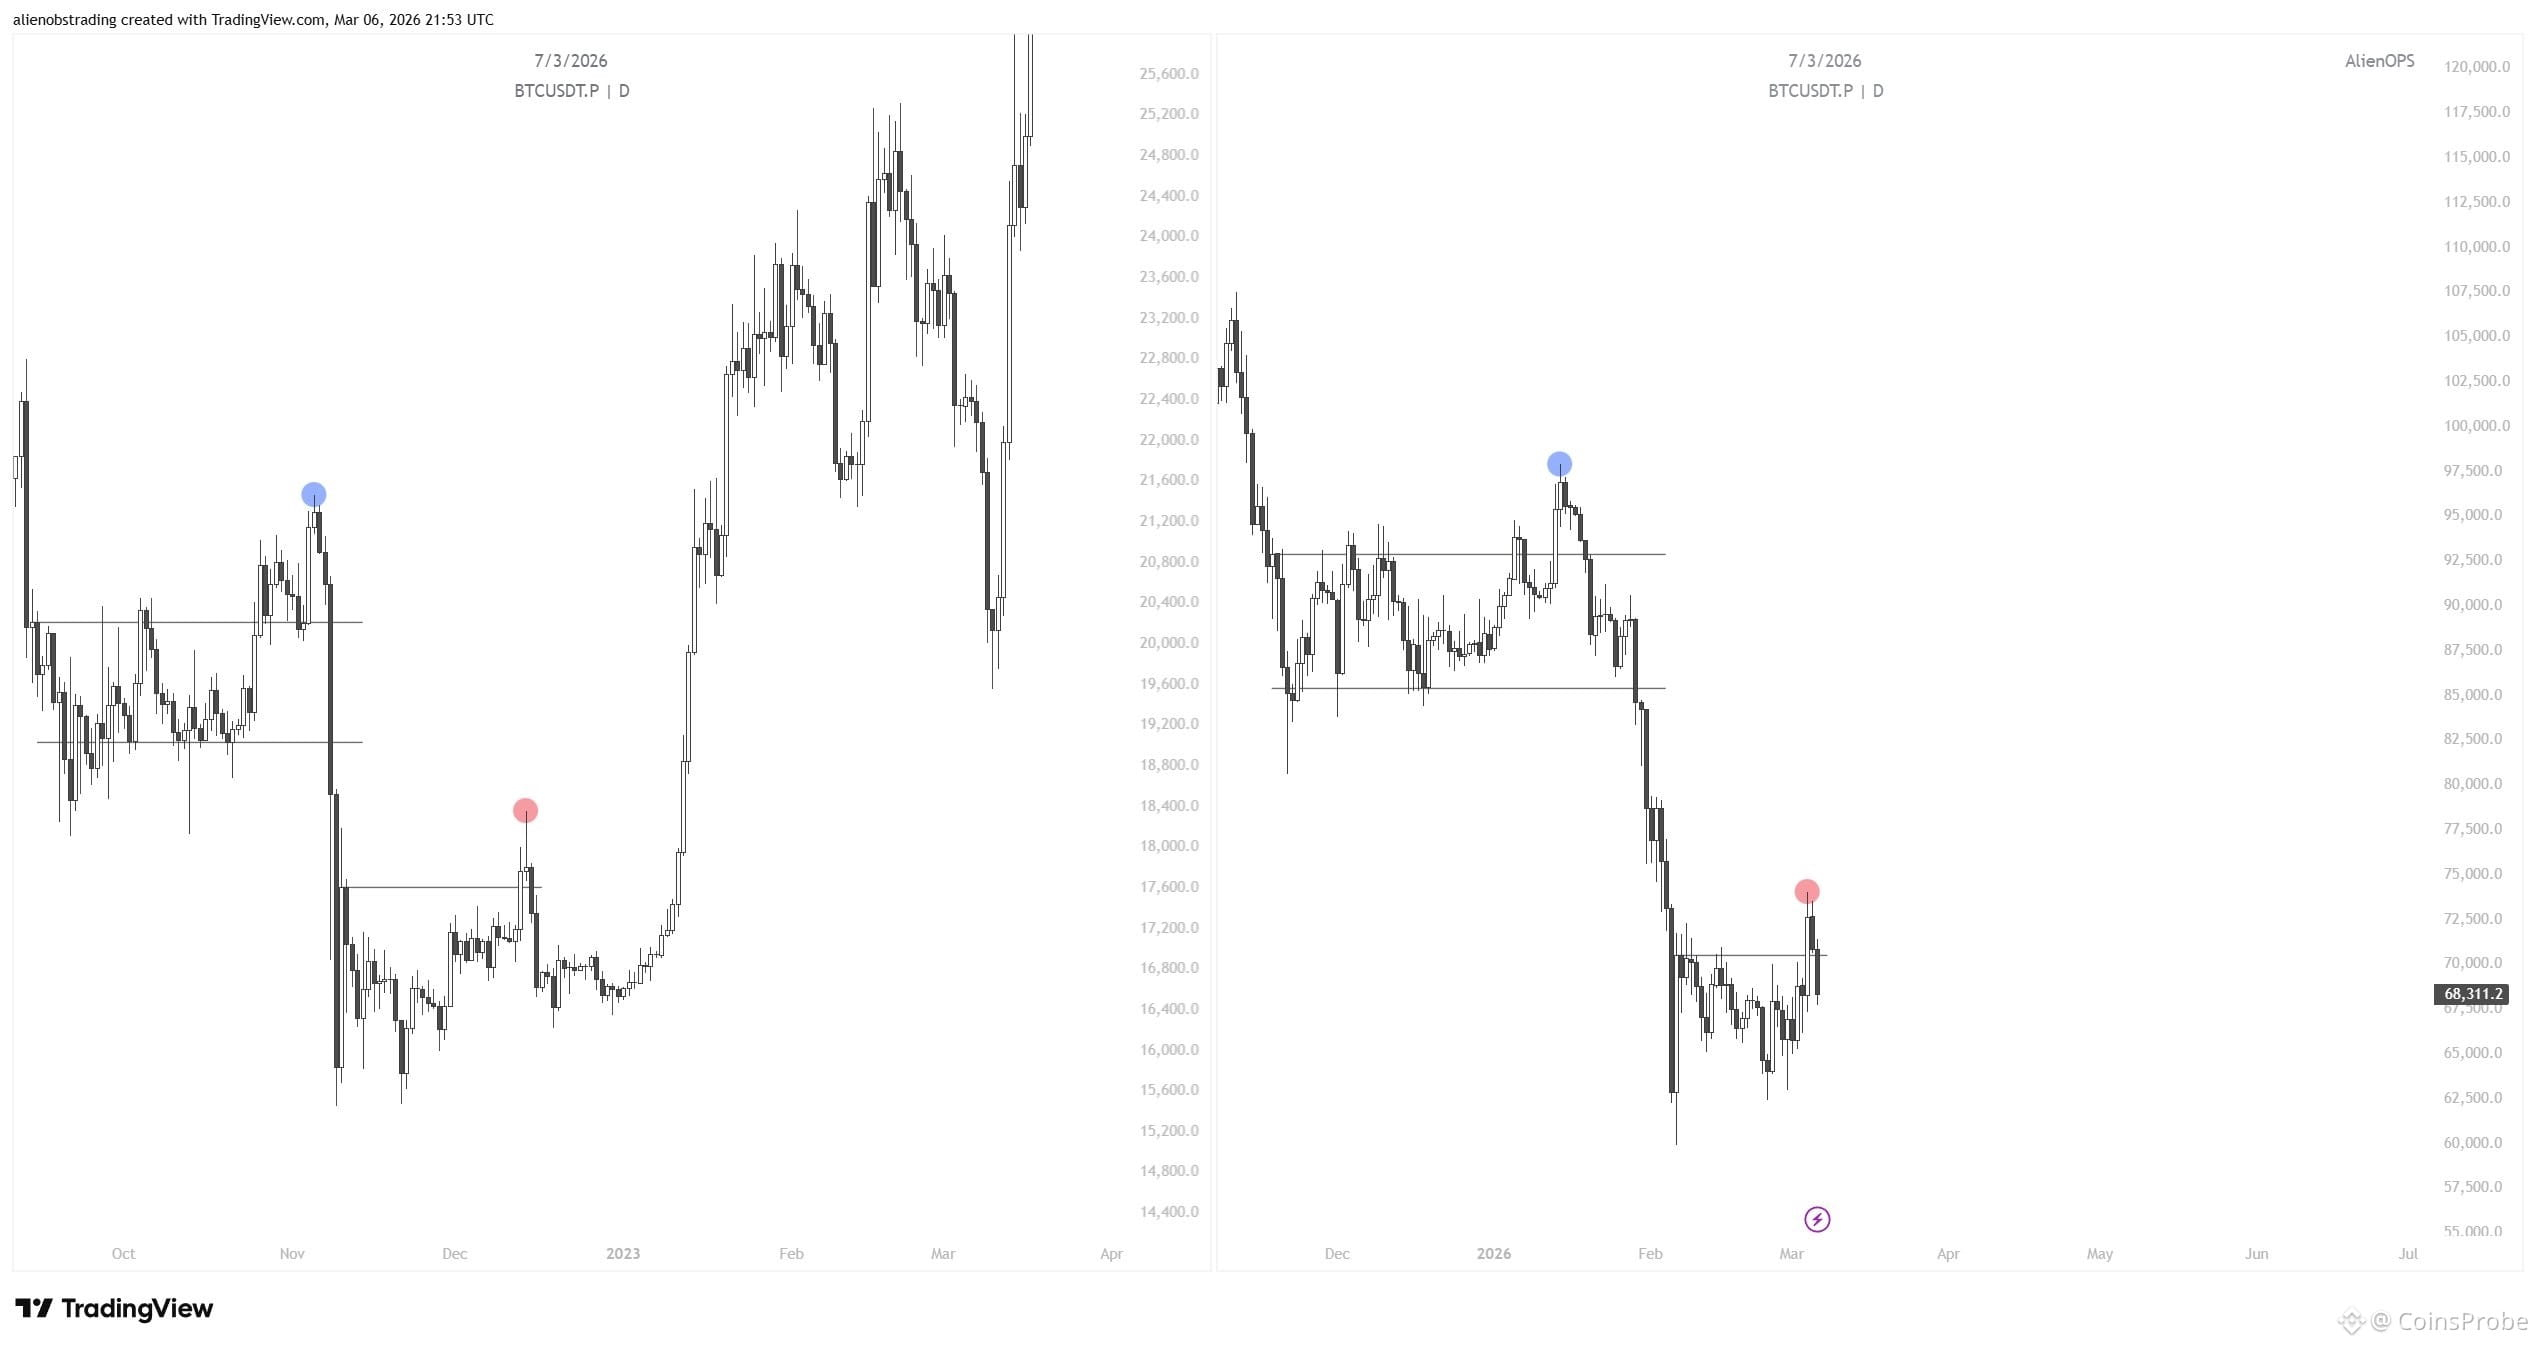 BTC Fractal Chart/Credits: @alienopstrading (X)
If this pattern continues to play out, Bitcoin could see a short-term pullback from the current levels, potentially revisiting lower support areas as the market resets leverage and liquidity.
However, the larger implication of the fractal is decidedly bullish.
In the previous example highlighted in the chart, the pullback phase was followed by a strong reversal and an explosive rally. Should the current setup mirror that behavior, Bitcoin could eventually regain momentum and push back toward the $100,000 level and potentially beyond once the consolidation phase completes.
In other words, the fractal suggests that the current market weakness may not represent the start of a deeper bear market, but rather a transitional phase where Bitcoin builds the foundation for its next major upside expansion.