📉 Short-Term $ETH ETH Structure (1H–2H Chart)
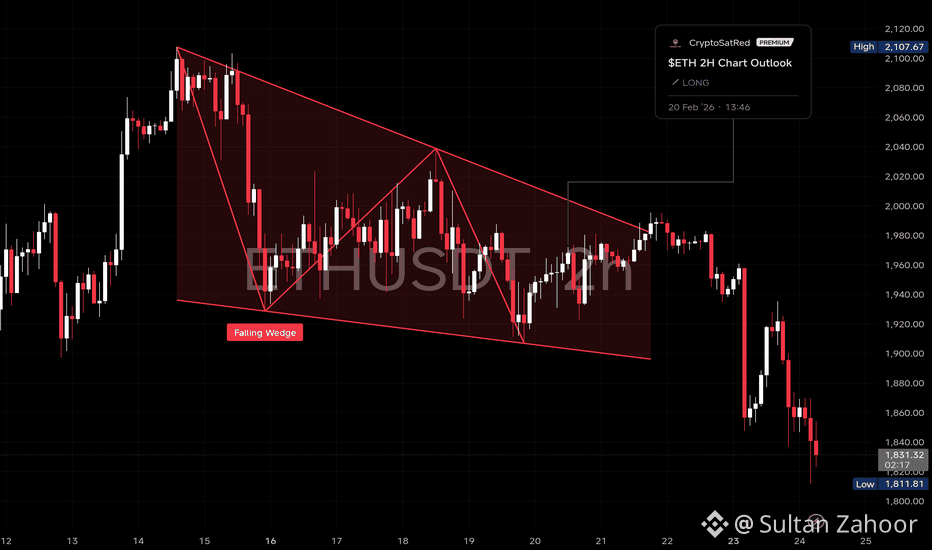
What this chart structure shows:
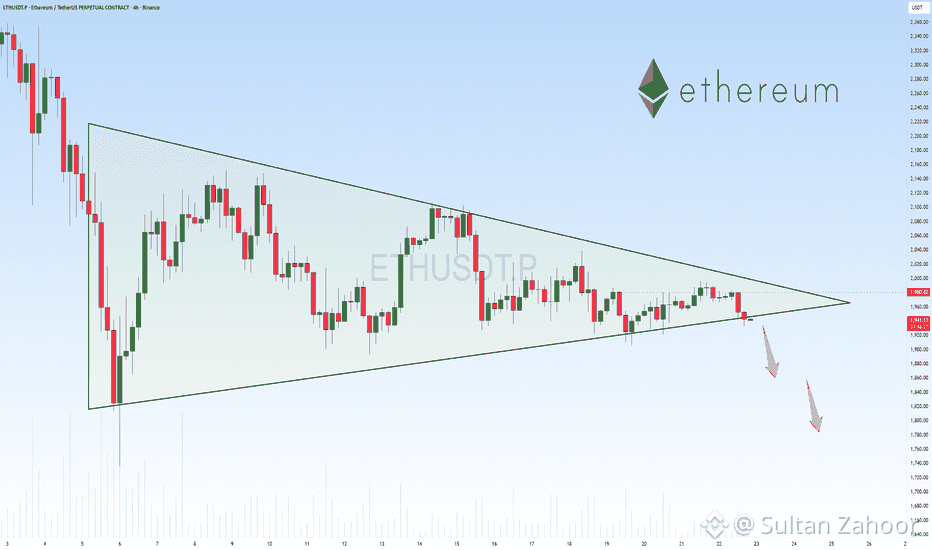
ETH formed a falling wedge / descending channel
Multiple rejections near the $2,000 zone
Breakdown below $1,900 support
Market structure: lower highs + lower lows
📊 Short-term levels traders watch:
Resistance: $1,990 – $2,050
Support: $1,900
If $1,900 breaks → $1,800 – $1,750
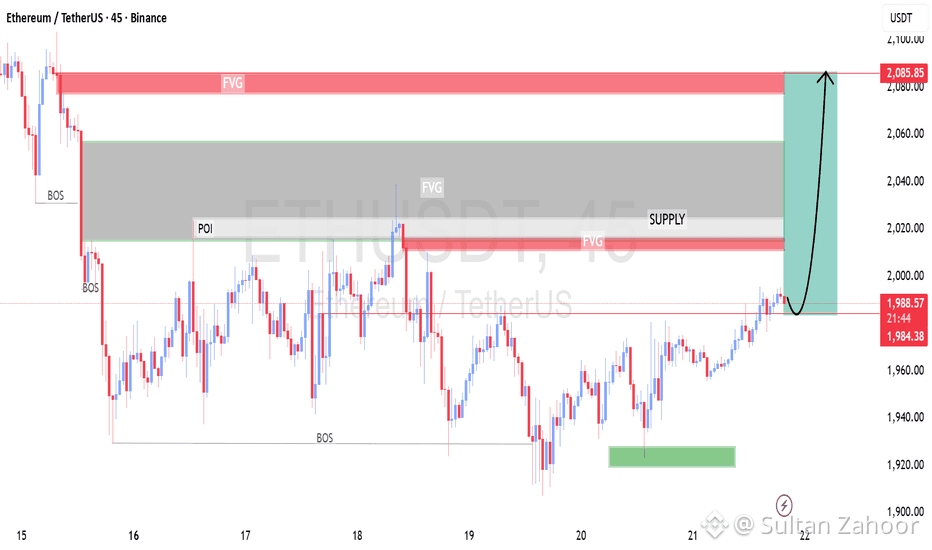
📊 Liquidity & Supply/Demand Zones
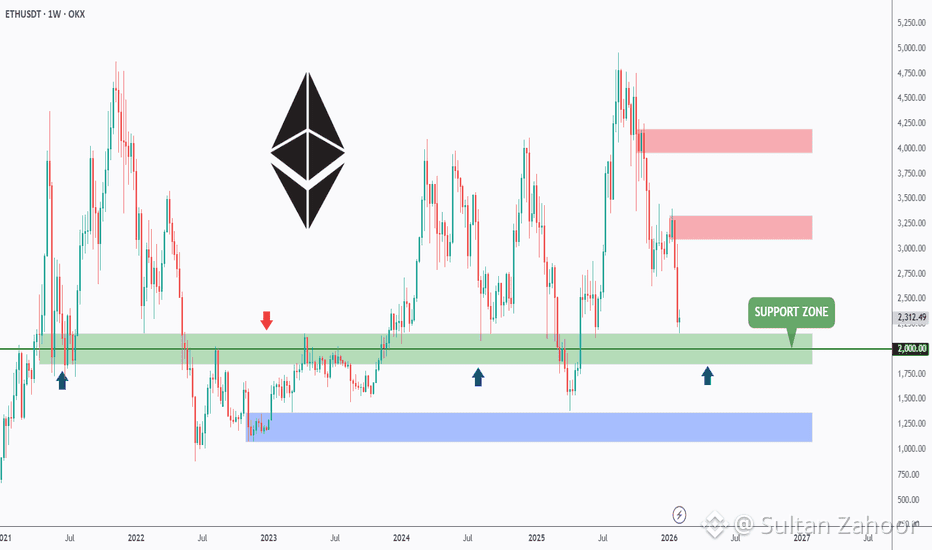
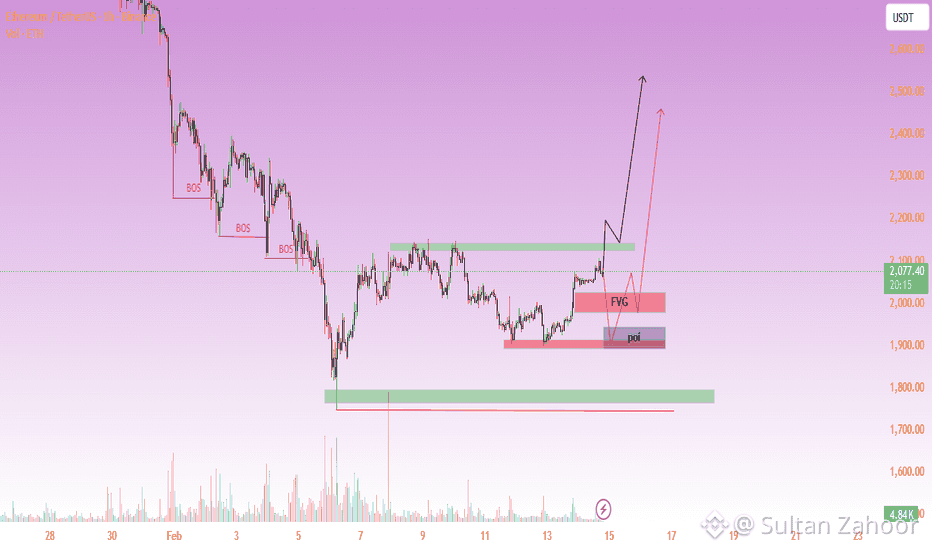
These TradingView setups highlight liquidity areas:
🟩 Demand zone
Around $1,750 – $1,820
Strong buying reactions expected
🟥 Supply zone
Around $2,050 – $2,150
Sellers previously entered here
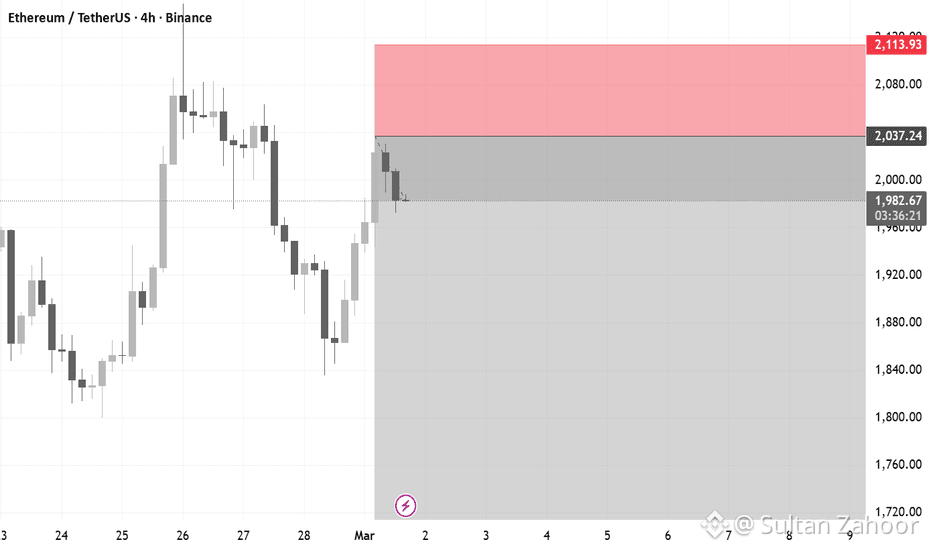
📉 Triangle or wedge patterns suggest a breakout soon.
📈 Possible Next Moves
Bullish Scenario 🐂
If ETH:
Reclaims $2,050
Holds above $2,000
Targets:
$2,200
$2,400
$2,600
Bearish Scenario 🐻
If ETH:
Loses $1,900 support
Targets:
$1,820
$1,750
$1,600
✅ Simple trader summary
Trend: Short-term bearish
Market phase: Consolidation before breakout
Key decision level: $1,900 – $2,000 range #ETHETFsApproved #EarnFreeCrypto2024 #Ethereum #AltcoinSeasonTalkTwoYearLow #SolvProtocolHacked