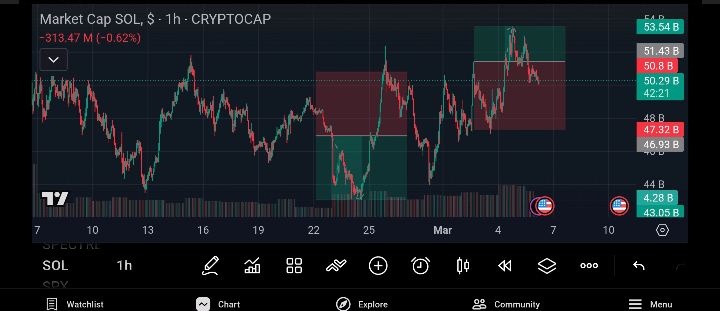
Solana’s market cap is currently hovering around $50B, showing a clear phase of range consolidation over the past few weeks.
From the chart, we can see a repeating structure:
• Strong demand zone near $43B–$44B, where buyers consistently step in.
• Supply pressure around $53B–$54B, where price repeatedly gets rejected.
This creates a clear range-bound market between $44B and $54B.
Recently, SOL attempted another breakout toward the $53B region, but the rejection suggests sellers are still defending that level aggressively.
What’s interesting is the higher lows forming after the late-February dip, which indicates buyers are slowly gaining control.
Key levels to watch:
📍 Support: $47B – Losing this could push the market cap back toward the $44B demand zone.
📍 Resistance: $53B – A clean breakout above this could open the door for a new expansion phase.
If buyers manage to reclaim and hold above $53B, Solana could enter a new bullish continuation structure.
Until then, the market remains in accumulation within a defined range.
Smart traders are watching for the range breakout rather than chasing the middle.