
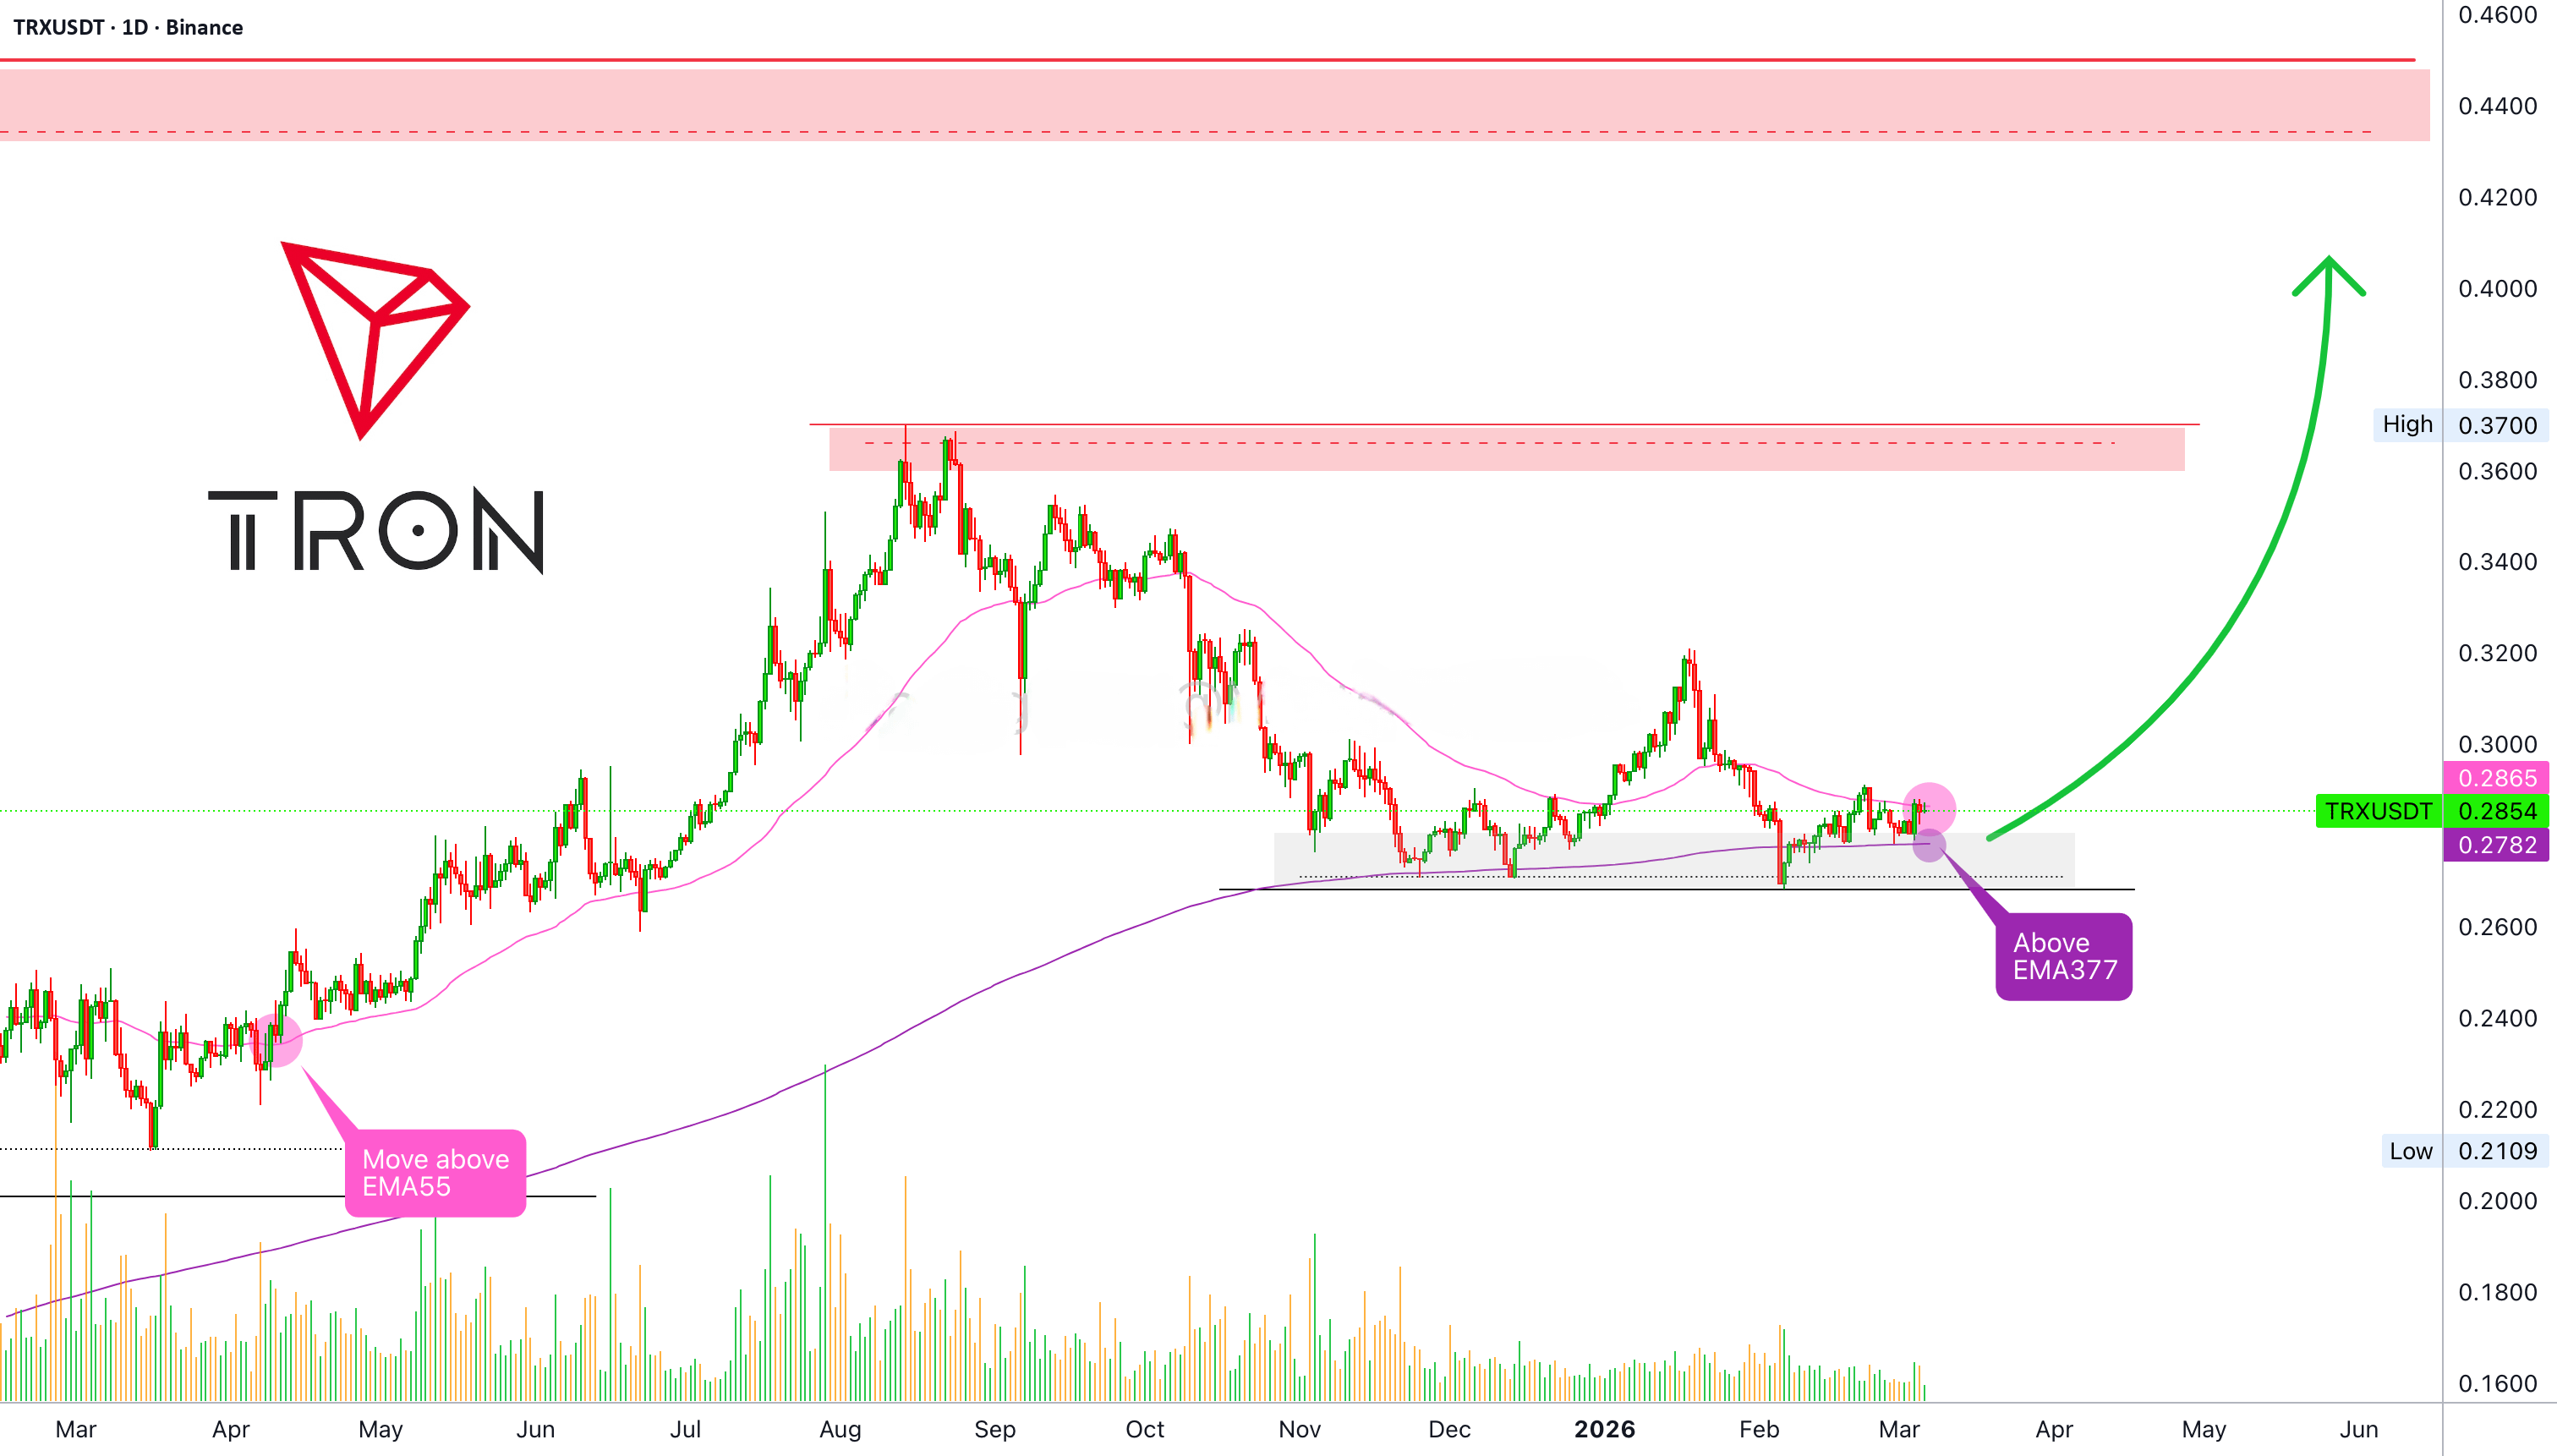
My intention was to show you EMA55 working as support. TRXUSDT moved below this level but it is actually being challenged as resistance. It has been hovering around this level for a little while and a bullish bias is confirmed as soon as it breaks. The bears gain favor if it holds.
A better indicator now to gauge Tron's bullish potential is EMA377. This is a long-term moving average. It has been working as support since November 2025.
Recently, TRXUSDT broke and close below it, 5-Feb, just to recover. It is the first time Tron moves below this level after the end of the eternal uptrend. Yet, the action is now happening safely above it as EMA55 continues to be challenged.
We are looking at bullish potential. Let me explain.
The main low from the correction that started mid-August 2025 was hit early November. After this, we see a flat bottom with multiple challenge of resistance. This reveals a bullish market bias.
Bearish would mean support weakening with each drop. Instead, we see how there is a tendency to push higher. It is as if the chart clearly reveals the market wanting to rise rather than drop. Still, this is a mixed chart.
As long as the long-term flat bottom remains active, the trade is long. If support breaks, then we consider the short side.
So far TRXUSDT has four months of consolidation. This is enough to support another price jump. Only if there is a failure to break immediate resistance, such as EMA55, can we say that lower prices are possible. Seeing how the entire market is undergoing a bullish consolidation, we continue aiming higher.
Namaste.
✅ Trade here on $TRX
