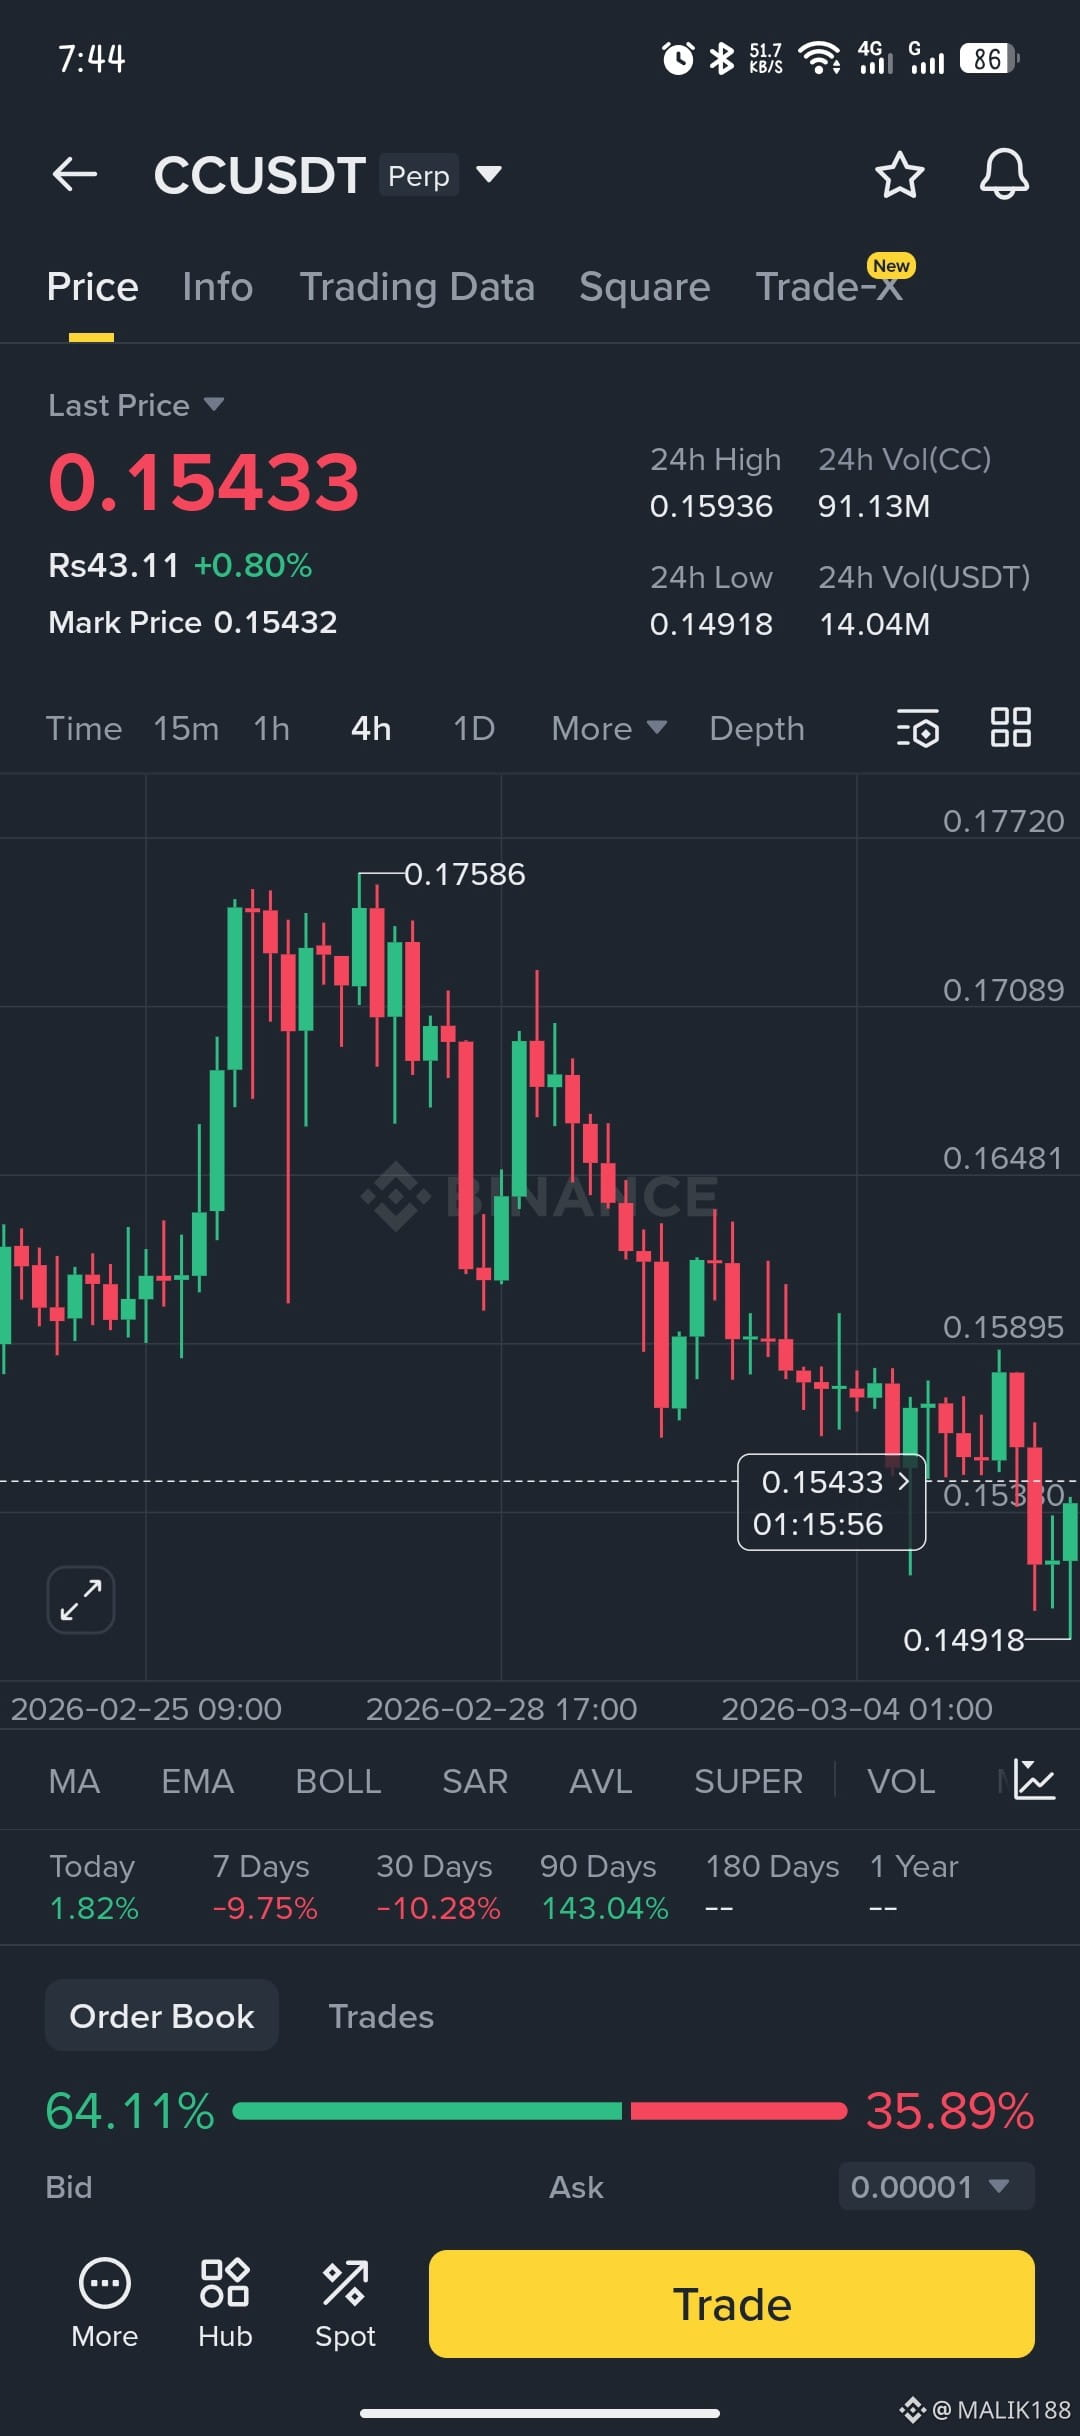
Based on the 4-hour chart you provided and the current market data for Canton Network (CCUSDT) as of March 6, 2026, the price is currently in a short-term bearish trend but approaching a critical "make-or-break" support zone.
Here is the breakdown of the next potential moves:
📊 Technical Outlook
The chart shows a series of "lower highs" and "lower lows," indicating a steady decline from the late February peak of 0.17586.
* Current Support (The Floor): The price is hovering around 0.15433. Looking at the historical wicks, the area between 0.1490 and 0.1530 is a major support zone. If it holds here, we could see a "double bottom" or a relief rally.
* The Bearish Risk: If the price closes a 4-hour candle below 0.14918 (your recent 24h low), the next target for the downside would likely be the 0.1460 level.
* Resistance (The Ceiling): To turn bullish again, CC needs to break and hold above 0.1635. Until it clears that level, any upward move is just a "dead cat bounce" (a temporary recovery in a falling market).
💡 Market Sentiment
* Order Book Strength: Your screenshot shows 64.11% Buy vs. 35.89% Sell. This suggests that while the price is dropping, there is significant "limit order" buying interest at these lower levels, which often precedes a bounce.
* Volume: The 24h volume is around 14M USDT. This is relatively moderate, meaning the current move lacks the massive "panic selling" volume that usually marks a final bottom.
🚀 The "Next Move" Scenarios
| Scenario | Price Action | Strategy Note |
|---|---|---|
| Bullish Bounce | Price holds 0.1500 and moves back toward 0.1650. | High probability of a relief rally due to the "Buy" wall in the order book. |
| Consolidation | Price sideways between 0.1520 and 0.1580. | Market waiting for BTC or broader market direction. |
| Bearish Break | Daily close below 0.1490. | Likely leads to a deeper correction toward 0.1350 - 0.1400. |
Summary: The most likely immediate move is a short-term bounce or sideways consolidation to test the strength of the buyers at 0.1500. However, the overall trend remains "Sell on Strength" until it breaks 0.1635.
> Note: This is an analysis of chart patterns and market data, not financial advice. Crypto markets are highly volatile!
>
Would you like me to check the latest news or social sentiment on Twitter/X to see if there's a specific event driving this dip?