📊 What The Daily Chart Shows
EMAs tell the whole story:
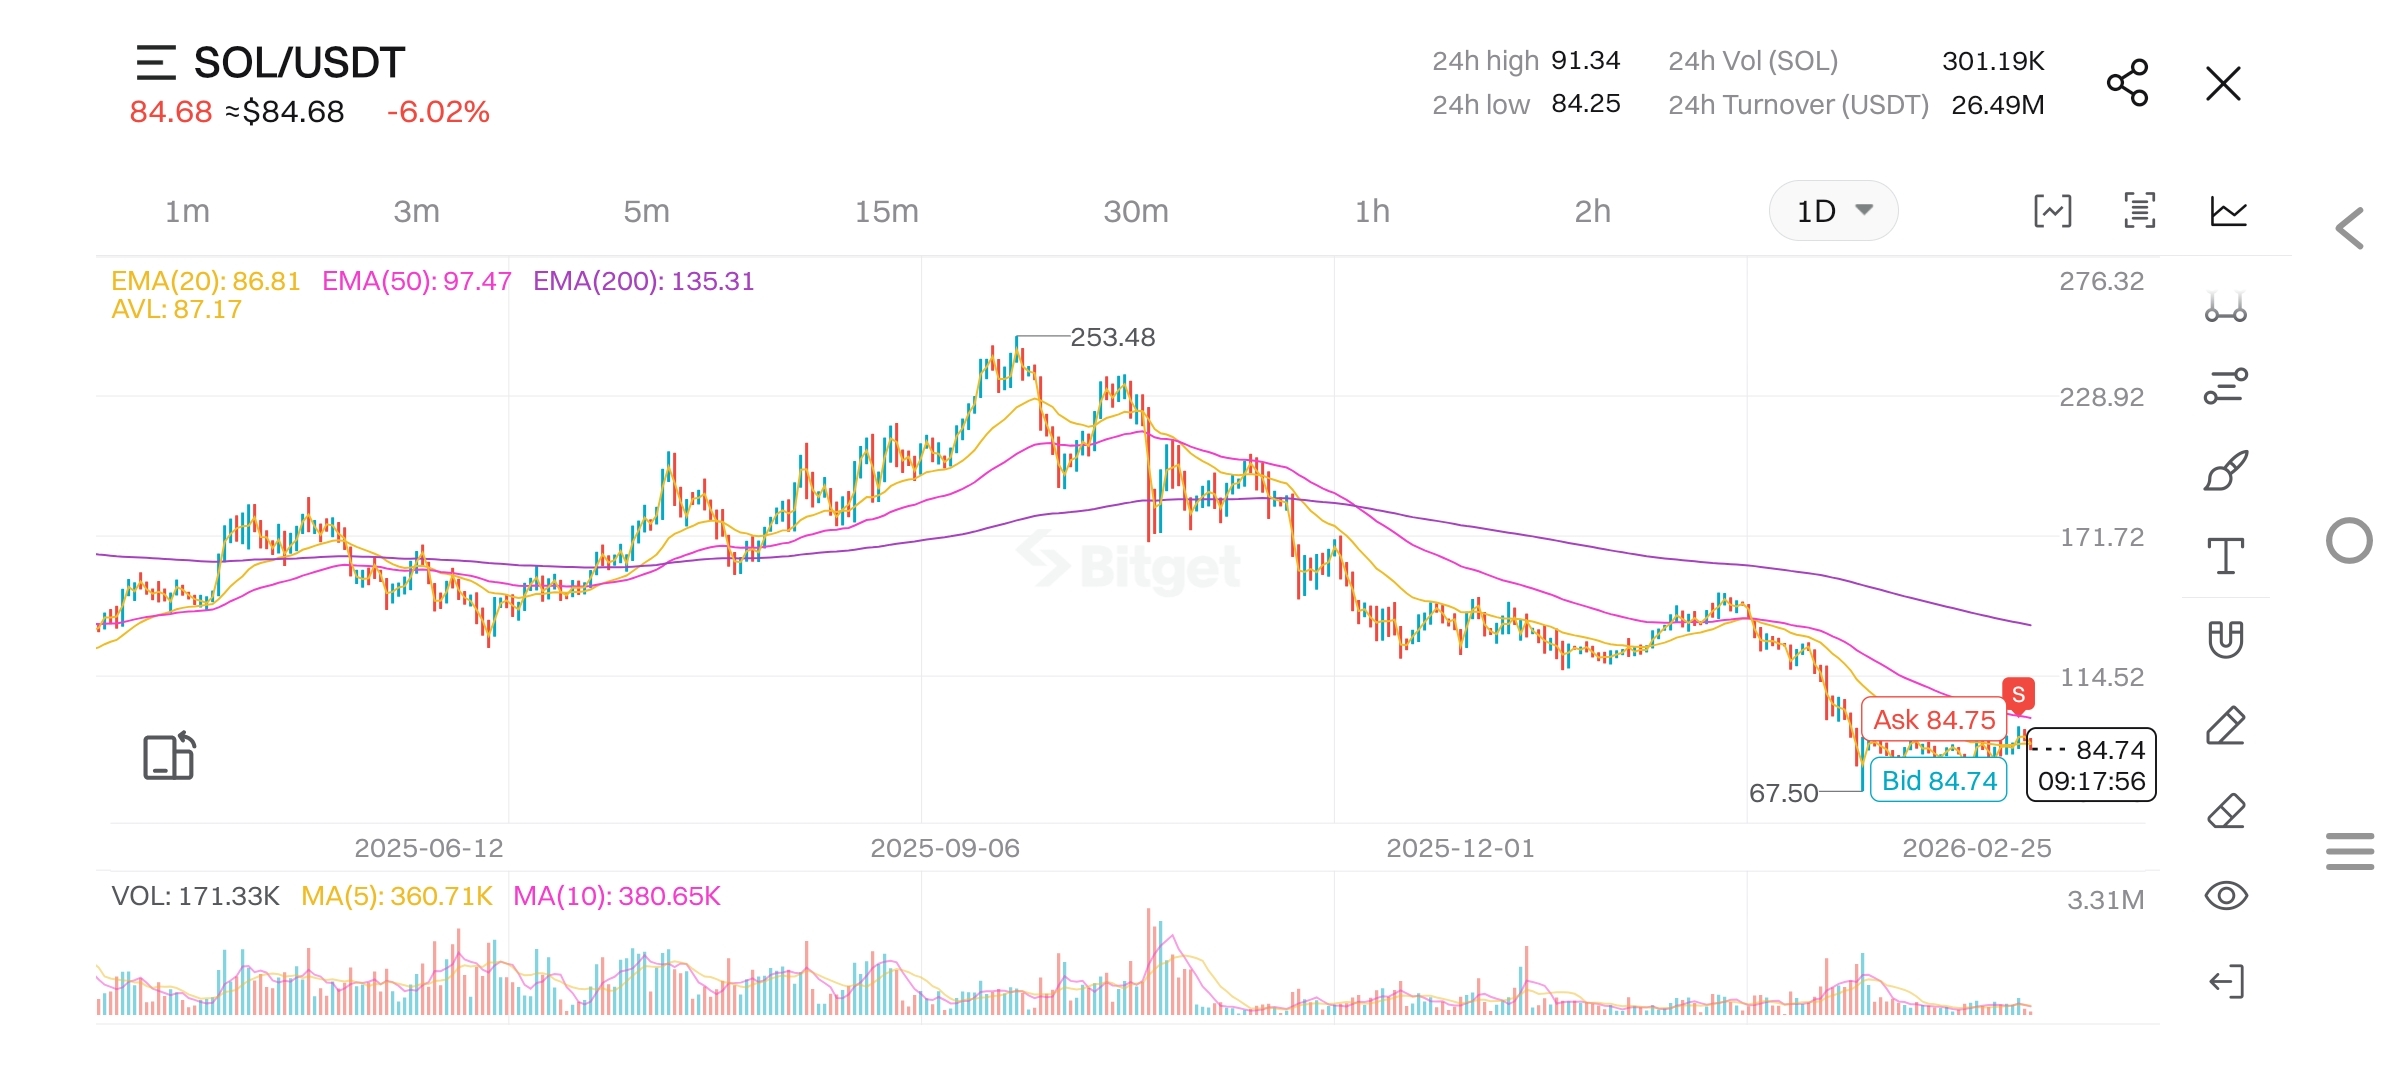
Price (84.68) is BELOW all three EMAs
EMA20: 86.81 → resistance right above
EMA50: 97.47 → far above, dead weight
EMA200: 135.31 → not even in the conversation
When price is below all EMAs on the daily — that's textbook bear market structure. No debate.
☠️ The Dangerous Reality
SOL ran from ~67 to 253 in 2025. It has now retraced 66% of that entire move.
The previous low was 67.50. That's only $17 away from current price. If 84 breaks — 67 is the next real floor. Nothing meaningful in between.
Volume is also dying. Current vol 171K vs MA5 of 360K — sellers aren't panicking anymore but buyers aren't showing up either. That's not bottoming — that's exhaustion before next leg.
🎯 Honest Probability From Daily Chart
SOL back to 90+ this month: 25% chance
SOL sideways 80-88 for weeks: 45% chance
SOL breaks down to 67-70: 30% chance
✅ Final Verdict
Do NOT buy right now with the daily looking like this. You need to see price close above EMA20 (86.81) on the daily candle first. That's your earliest valid entry signal.