📊 ZAMA — Daily Chart Summary (Crypto)
Current Price & Market Structure
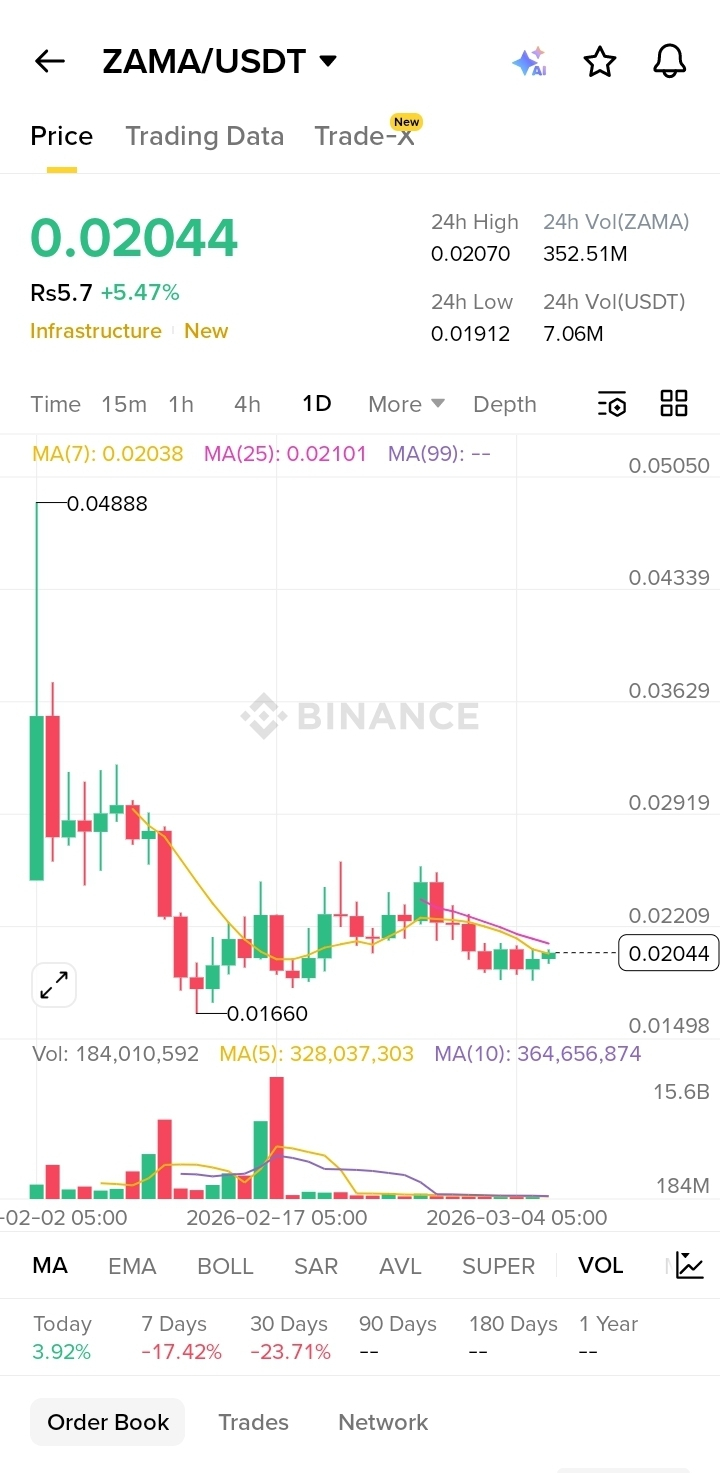
ZAMA is trading around $0.02–0.023 range with high volatility as price corrects after a big sell‑off since launch. �
CoinGecko +1
The token has retraced roughly ~40–50% from its all‑time highs — a common pattern for newly listed crypto tokens after initial hype fades. �
CoinGecko
Short‑term support appears near $0.018–$0.020 (recent lows), while resistance zones are at $0.022–$0.025 (recent swing highs). �
CoinGecko +1
🛠️ Technical Indicators on Daily Chart
💡 Trend & Moving Averages
Price is below key moving averages (e.g., 50‑day and higher), signaling that short to medium trend pressure is bearish. �
WEEX
Downward sloping moving averages act as resistance, limiting upward momentum.
📉 Momentum & Oscillators
RSI (Relative Strength Index) is often in neutral to oversold territory after sharp drops — this can signal short‑term exhaustion of selling pressure. �
WEEX
Mixed oscillator signals suggest no clear strong directional bias, but buyers may step in near key support levels, while sellers dominate closer to resistance.
📊 Volume
Large volume spikes often accompany big moves in ZAMA — rising volume on up‑moves suggests conviction, while rising volume on down‑moves reinforces selling pressure. �
CoinMarketCap
📌 Daily Trader Levels (Hypothetical)
Support Zones (Buyers defend)
✅ Primary: ~$0.018–$0.019
✅ Secondary: ~$0.017
Resistance (Sellers strong near)
🚫 Immediate: ~$0.022
🚫 Major: ~$0.025+
Breakout/Breakdown Triggers
➡️ Bullish trigger: Break above $0.022 with strong volume — sets up potential move toward $0.025+.
⬇️ Bearish trigger: Close below $0.018 — risk of deeper retracement or lower low.
📌 Short‑Term Price Bias
Neutral to Slightly Bearish until ZAMA decisively holds above resistance ($0.022) or support breakdown occurs.
Traders should watch daily candle closes and volume confirmation around those areas.
🧠 Key Notes for Traders
✔ Volatility: ZAMA is new and highly volatile — stop‑loss placement and position sizing are crucial.
✔ Liquidity: Volume spikes drive short‑term moves — always check live exchange order books.
✔ Risk Events: Upcoming token unlocks, broader market sentiment, and macro crypto moves can add pressure. �
✔ Technical Setup: A clear break above resistance with rising volume suggests trend reversal; failing that, range trading is more likely.
CoinMarketCap
📉 Risk Highlights
⚠ Token is still relatively new — high price swings and wide spreads are common.
⚠ Broader crypto market weakness can drag price lower even if Zama has positive news.
⚠ Always combine technicals with proper risk management and not rely on a single signal.#Zama