The recent "war week" rally, which saw Bitcoin climb approximately 15% in five days, has encountered significant technical friction. As of March 6, the market is undergoing a corrective phase, testing the strength of new support levels established during the recent surge.
1️⃣ Technical Barriers: The $74,000 Resistance Zone
Bitcoin’s recent peak at $74,062 aligned precisely with two major technical indicators: the 61.8% Fibonacci retracement level and the 50-day moving average. Historically, these levels act as a "crowded" resistance area where sellers and profit-takers often outweigh buyers.
● Current BTC Status: After failing to sustain a move above $74k, BTC has pulled back to the $70,900 range.
● Immediate Support: The $70,000 psychological floor is the primary area of interest. A failure to hold this level could see a retest of the $69,000 bullish trend line.
● Trend Confirmation: Analysts suggest that a confirmed daily close above $74,400 would be required to invalidate the current mid-term downtrend and signal a new bull phase.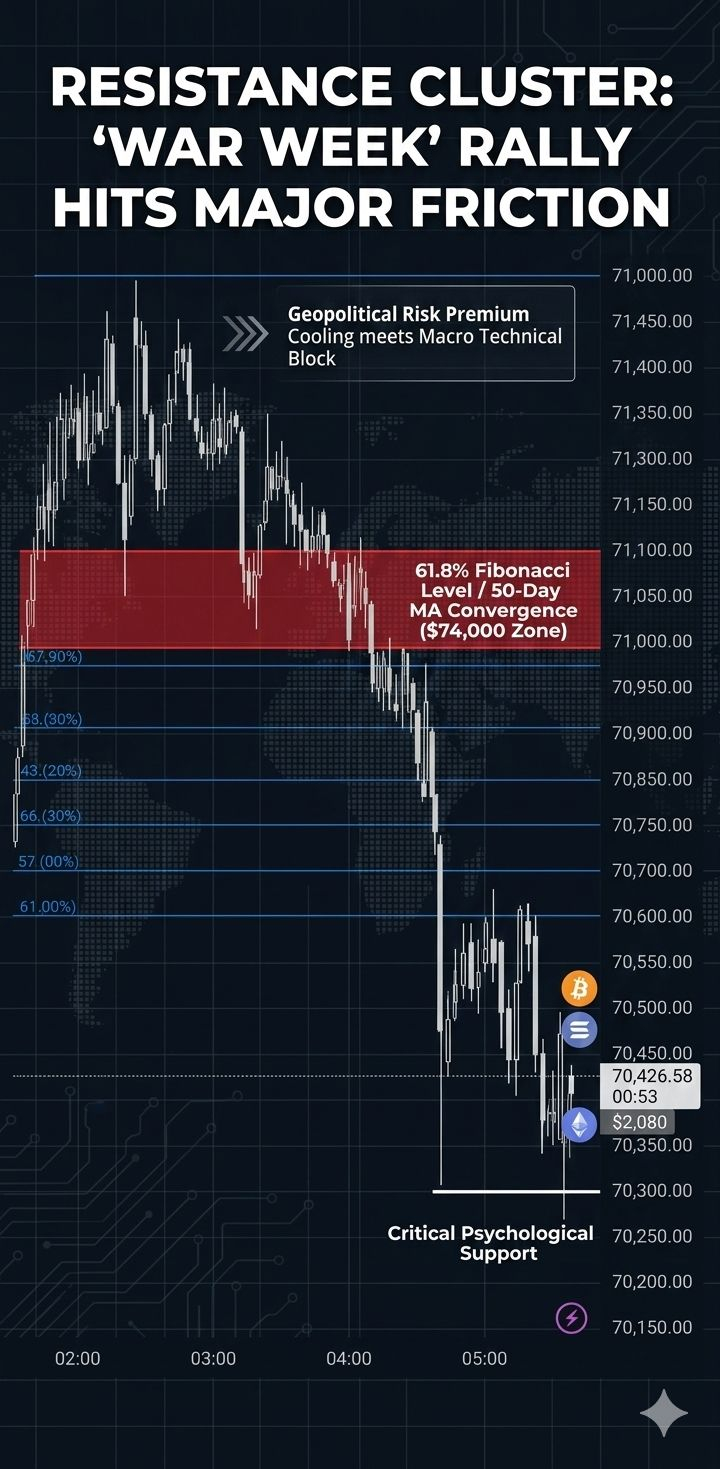
2️⃣ Institutional Inflows vs. Geopolitical Cooling
The volatility this week has been characterized by two competing forces: heavy institutional buying and shifting geopolitical risk premiums.
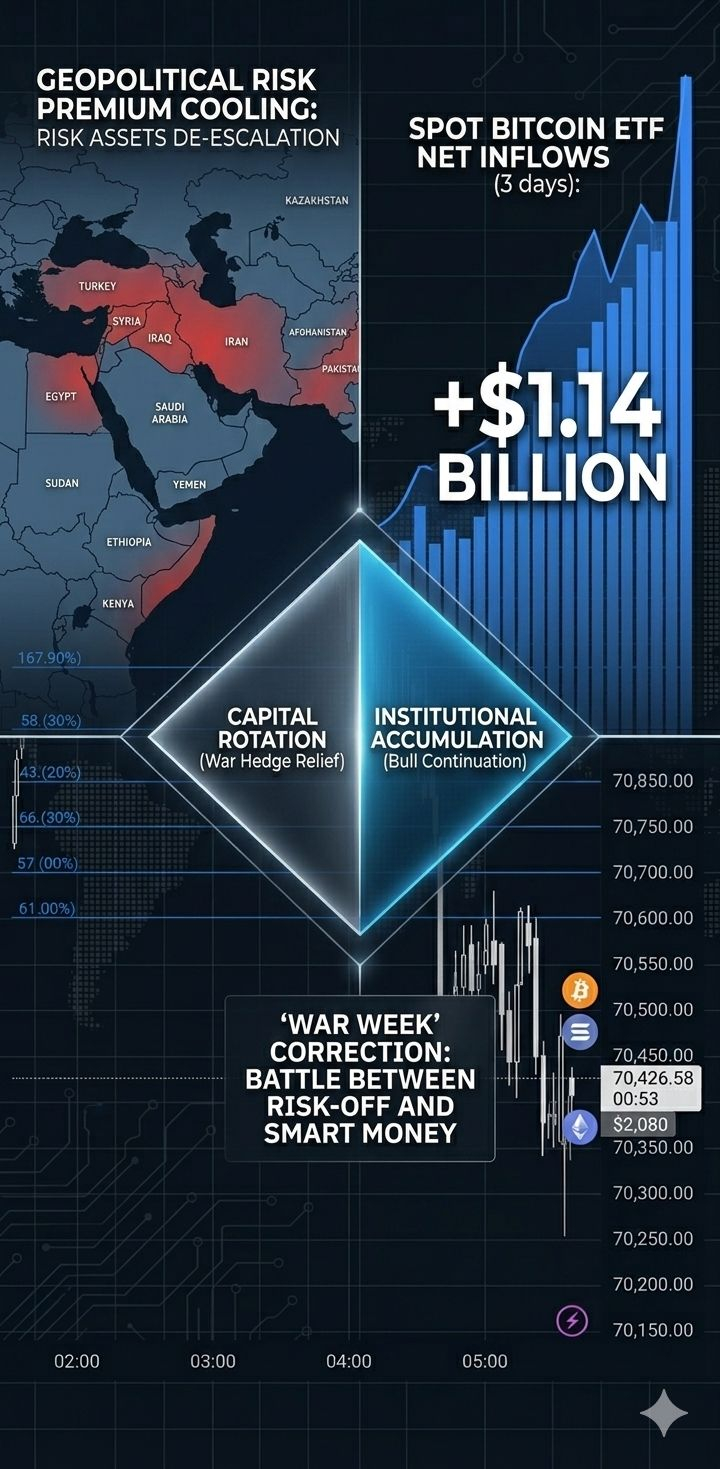
● ETF Activity: Despite the price slide, institutional demand remains robust. Spot Bitcoin ETFs recorded over $1.14 billion in net inflows over the last 72 hours, suggesting that "smart money" is utilizing these price levels as accumulation zones rather than exit points.
● Macro Shift: The "War Week" rally was largely fueled by capital rotating into digital assets as a hedge against Middle East tensions. As de-escalation hopes emerge, that specific risk premium is being priced out, leading to the current "relief" correction.
● Ethereum Stability: $ETH is maintaining a more stable posture around $2,085. While it slid with the broader market, it remains above the critical $2,000 support level, which is currently backed by high staking participation and reduced liquid supply.
3️⃣ Key Price Levels to Monitor for Decision-Making
For those tracking the next directional move, the following price coordinates are essential for assessing market strength:
🎯 Bitcoin ($BTC) Price Levels

● Critical Support Zones:
* $70,000 (Psychological): This is the primary level investors are watching. Holding above this round number is essential for maintaining a "bullish" market sentiment.
* $66,200 (Major): This represents a deeper structural support. If the $70k floor fails, this is the area where significant buying interest has historically re-entered the market.
● Resistance to Break:
* $72,500 (Immediate): The first hurdle. Bitcoin needs to flip this level from resistance back to support to regain short-term momentum.
* $74,400 (Trend Pivot): This is the "line in the sand." Breaking above this level would likely invalidate the current correction and signal a continuation of the macro uptrend.
💎 Ethereum ($ETH) Price Levels

● Critical Support Zones:
* $2,000 (Structural): This is the most significant floor for ETH. It represents a major consolidation zone; dropping below this could lead to a shift in the medium-term trend.
● Resistance to Break:
* $2,100 (Recent High): ETH has faced selling pressure here recently. Clearing this level is the first step toward a recovery.
* $2,147 (Supply Zone): A heavy concentration of sell orders sits here. Successfully breaking through this zone would likely trigger a move toward higher targets.
The current "bear-flag" consolidation below $72,000 suggests the market is in a wait-and-see mode. For Ethereum, the $2,100 mark remains the gateway to a more convincing recovery signal, while Bitcoin’s ability to turn $70,000 into a firm "launchpad" will likely determine the trajectory for the remainder of Q1.