
In July 2025, spot Solana ETFs launched in the U.S., giving investors an easy, regulated way to gain exposure to $SOL without directly holding the cryptocurrency. The timing couldn't have been worse: SOL's price has plunged about 57% since then, caught in a broader crypto downturn driven by macroeconomic pressures, rate uncertainty, and shifting market sentiment.
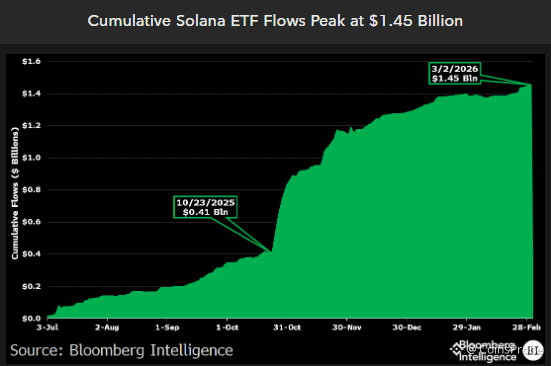
Yet, as Bloomberg Senior ETF Analyst Eric Balchunas pointed out in his March 5, 2026, post, these funds have quietly amassed roughly $1.45–1.5 billion in cumulative net inflows. More impressively, most of that capital has stayed put—no major outflows despite the brutal price action.
 Cumulative Solana ETF Flows/Credits: @EricBalchunas (X)
Key Data from the Chart
Cumulative Flows: The chart tracks net money flowing into Solana ETFs from launch through early March 2026. It shows steady upward momentum, reaching ~$1.45 billion by March 3. Small dips occur, but the overall trend is positive and resilient.
Institutional Commitment: About 50% of the assets come from 13F filers—large institutional investors (hedge funds, asset managers) required to disclose holdings quarterly. This signals serious, long-term conviction rather than short-term retail speculation.
Price Context: SOL launched ETFs amid hype around Solana's high-speed blockchain, DeFi growth, and ecosystem momentum. But broader market headwinds led to a sharp decline, turning what could have been a launch rally into a prolonged drawdown.
The Bitcoin Comparison – Why This MattersBalchunas adds a powerful perspective by adjusting for market cap differences: Solana is much smaller than Bitcoin. Scaling the $1.5 billion Solana flows to Bitcoin's size makes them equivalent to roughly $54 billion in Bitcoin ETF inflows at a comparable stage post-launch.
For context:
Bitcoin ETFs (launched in early 2024) saw about half that amount (~$27 billion) in the same relative timeframe—and BTC was rising sharply during that period, fueling hype-driven inflows.
Solana's equivalent demand arrived during a 57% crash, with investors holding firm.
This adjusted metric reveals outsized institutional appetite for SOL exposure, even in adverse conditions. It's a sign of underlying strength that raw numbers alone might miss.
Underlying Ecosystem Strength: Record-Breaking Stablecoin Volumes
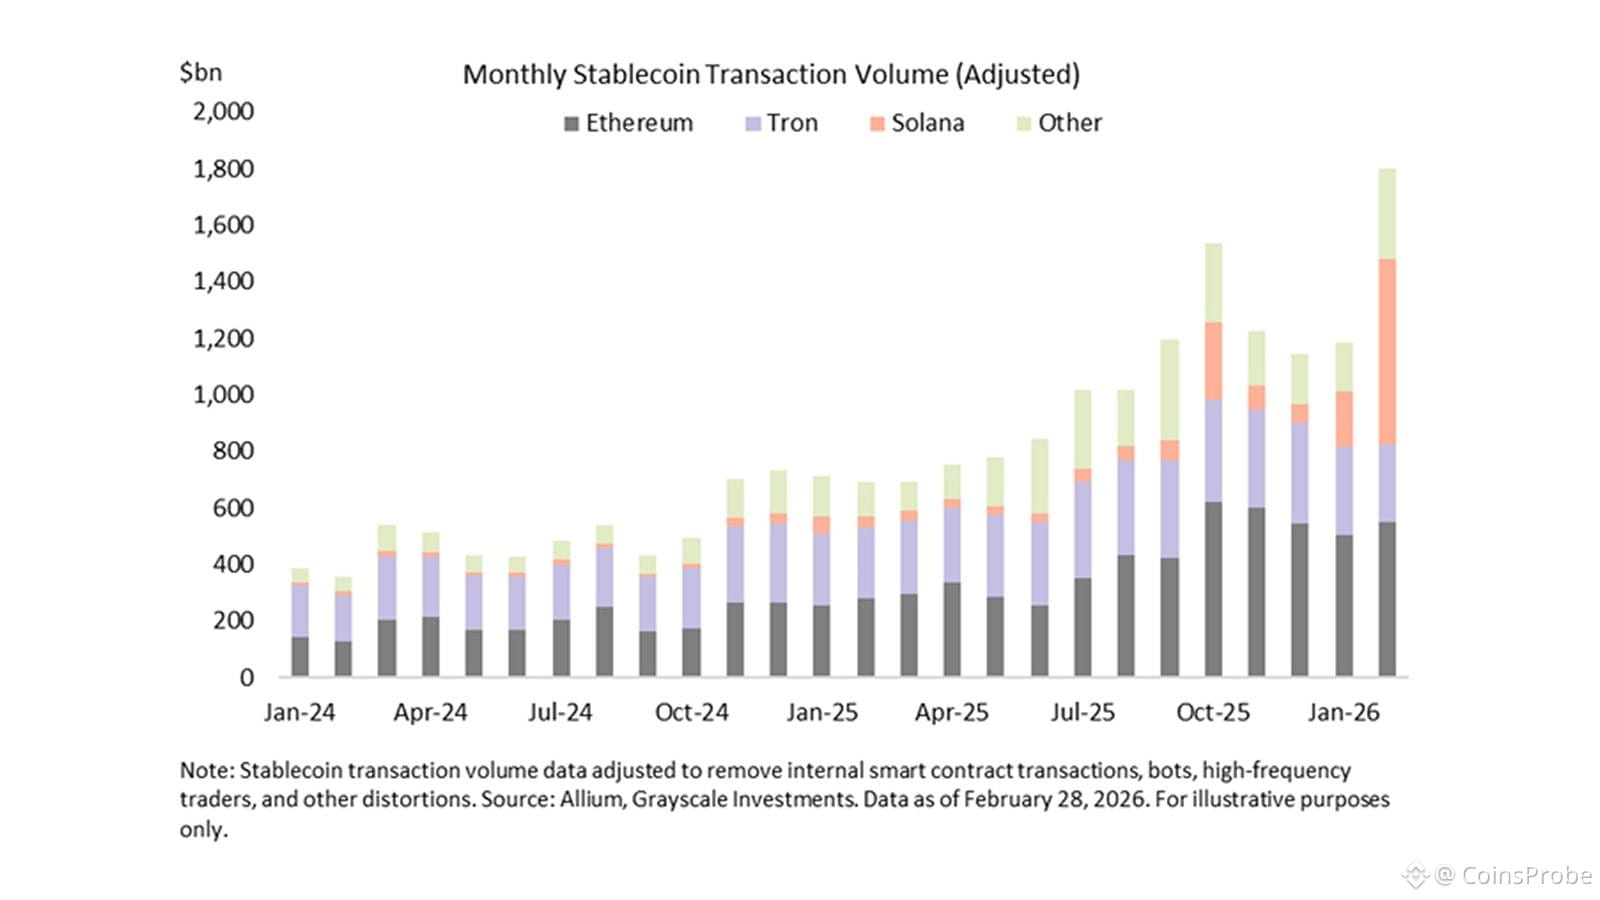
Adding to the bullish case for Solana is its explosive growth in real-world usage, particularly in stablecoin transactions. In a March 5, 2026, post, Grayscale CEO Peter Mintzberg highlighted Solana's "scale in practice," noting that February 2026 stablecoin transaction volume on Solana hit a record $650 billion—more than double the previous high from October of the prior year.
This surge, driven by the vibrant Solana community and on-chain economy, positioned Solana as the leader in stablecoin volume among all blockchains that month.
 Monthly Stablecoin Transaction Volume/Credits: @PeterMintzberg (X)
The accompanying chart from Grayscale illustrates monthly adjusted stablecoin transaction volumes across major chains from January 2024 to January 2026. Key observations:
Total volumes have grown dramatically, from around $200 billion in early 2024 to over $1,800 billion by January 2026.
Ethereum (gray) held early dominance but has seen its share erode.
Tron (purple) captured significant mid-period growth, often leading in 2024–2025.
Solana (orange) began accelerating around mid-2025, with its share expanding rapidly in late 2025 and early 2026.
"Other" chains (green) also contributed to the overall uptrend.
These volumes are adjusted to exclude distortions like internal smart contract activity, bots, and high-frequency trading, focusing on genuine usage. Grayscale's Head of Research, Zach Pandl, emphasized in the linked report that "Solana is well placed to capture market share in retail stablecoin payments" due to its leadership in users, transaction volume, and fees. He views stablecoins as a "megatrend driving adoption of blockchain technology," with Solana's depth and diversity in on-chain activity making it a strong competitor.
This real-usage momentum underscores why institutions are piling into Solana ETFs despite the price dip: It's not just speculation; it's evidence of Solana's potential to become a backbone for tokenized assets, DeFi, and payments.
What This Signals for Solana's Future
Quiet Accumulation: Steady inflows through a downtrend often indicate "smart money" buying the dip, building positions while retail panic sells off. The high institutional share (via 13F) supports this—big players see long-term value in Solana's tech (fast transactions, low fees, thriving DeFi/NFT/memecoin ecosystem).
Strong Foundation: ETFs provide liquidity, credibility, and easier access for traditional finance. Holding $1.5 billion despite price pain shows conviction in Solana's fundamentals over short-term volatility. The stablecoin data adds another layer, proving scalable, real-world adoption.
Bullish Long-Term Indicator: In crypto cycles, periods of accumulation during weakness frequently precede rotations and rallies (especially as Bitcoin dominance peaks and capital flows into alts). This could position Solana for outperformance if macro conditions improve or ecosystem catalysts—like further stablecoin integrations—emerge.
Bottom Line
Solana ETFs' performance defies the narrative of fading interest. Launching into one of the worst possible environments and still attracting—and retaining—billions in capital (with heavy institutional backing) is a testament to genuine demand. Combined with record stablecoin volumes signaling robust ecosystem growth, it's an "excellent indicator" for the asset's future resilience and potential upside.
While crypto remains volatile and past performance isn't a guarantee, this data suggests patient investors are betting on Solana's recovery and growth story. For those watching altcoins, it's a reminder: sometimes the strongest signals come not from price spikes, but from who keeps buying—and using—the network when everyone else is selling.
Disclaimer: The views and analysis presented in this article are for informational purposes only and reflect the author’s perspective, not financial advice. Technical patterns and indicators discussed are subject to market volatility and may or may not yield the anticipated results. Investors are advised to exercise caution, conduct independent research, and make decisions aligned with their individual risk tolerance.