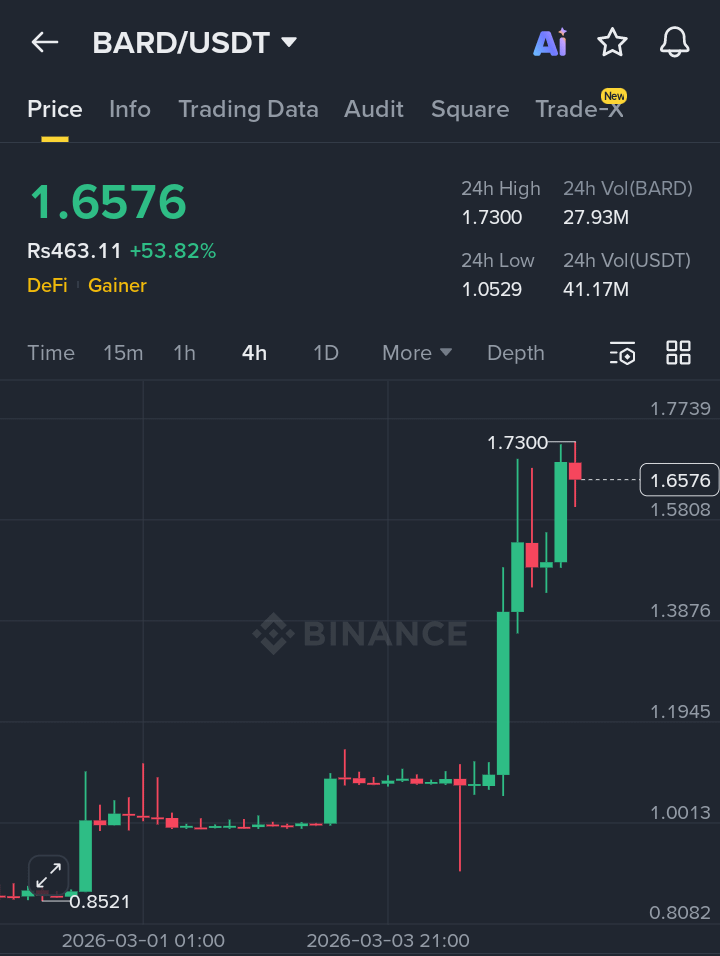
$BARD has recently entered a strong bullish phase, with the price climbing to around $1.6576 after posting a significant intraday move of more than 50%. The chart structure shows a clear breakout from a long consolidation zone near the $1.00 region, where the market had been trading sideways for several sessions. Once buyers absorbed the available supply in that range, a strong impulsive move followed, pushing the price rapidly toward the $1.70 area. Increased trading volume also confirms that this move is supported by fresh liquidity entering the market.
From a technical perspective, the breakout occurred after a period of price compression, which typically precedes strong directional moves. The 4H chart shows multiple strong bullish candles with higher highs and higher lows, indicating aggressive buying pressure. The recent wick rejection near $1.73 suggests that short-term profit taking is happening, but the overall structure still favors buyers as long as price holds above the previous breakout region.
Looking at potential trading zones, the key accumulation support now sits between $1.38 and $1.52, where previous resistance has flipped into support. If the price holds this region, the next bullish continuation targets could sit around $1.73 and potentially the psychological $1.90 level. However, if the market loses the $1.38 structure, the price could temporarily revisit the $1.20 area for deeper liquidity before the next move.
As always, traders should closely monitor overall market sentiment, particularly movements in $BTC and $ETH since broader crypto momentum often influences altcoin continuation trends.
If you found this analysis helpful, make sure to Like and Follow for more market insights and trading updates. 📊
#Bard #CryptoAnalysis #BinanceSquare #altcoins