

I have given deep research on $ETH chart on its technical view and I found that we can take best entries at this price it will be not for us to take long entry keeping in view about the SL & TP.
I also shared the chart below so you can see and also learn something,,,, if I made any mistake you can also let me know it will be a really good thing for me to learn from. you

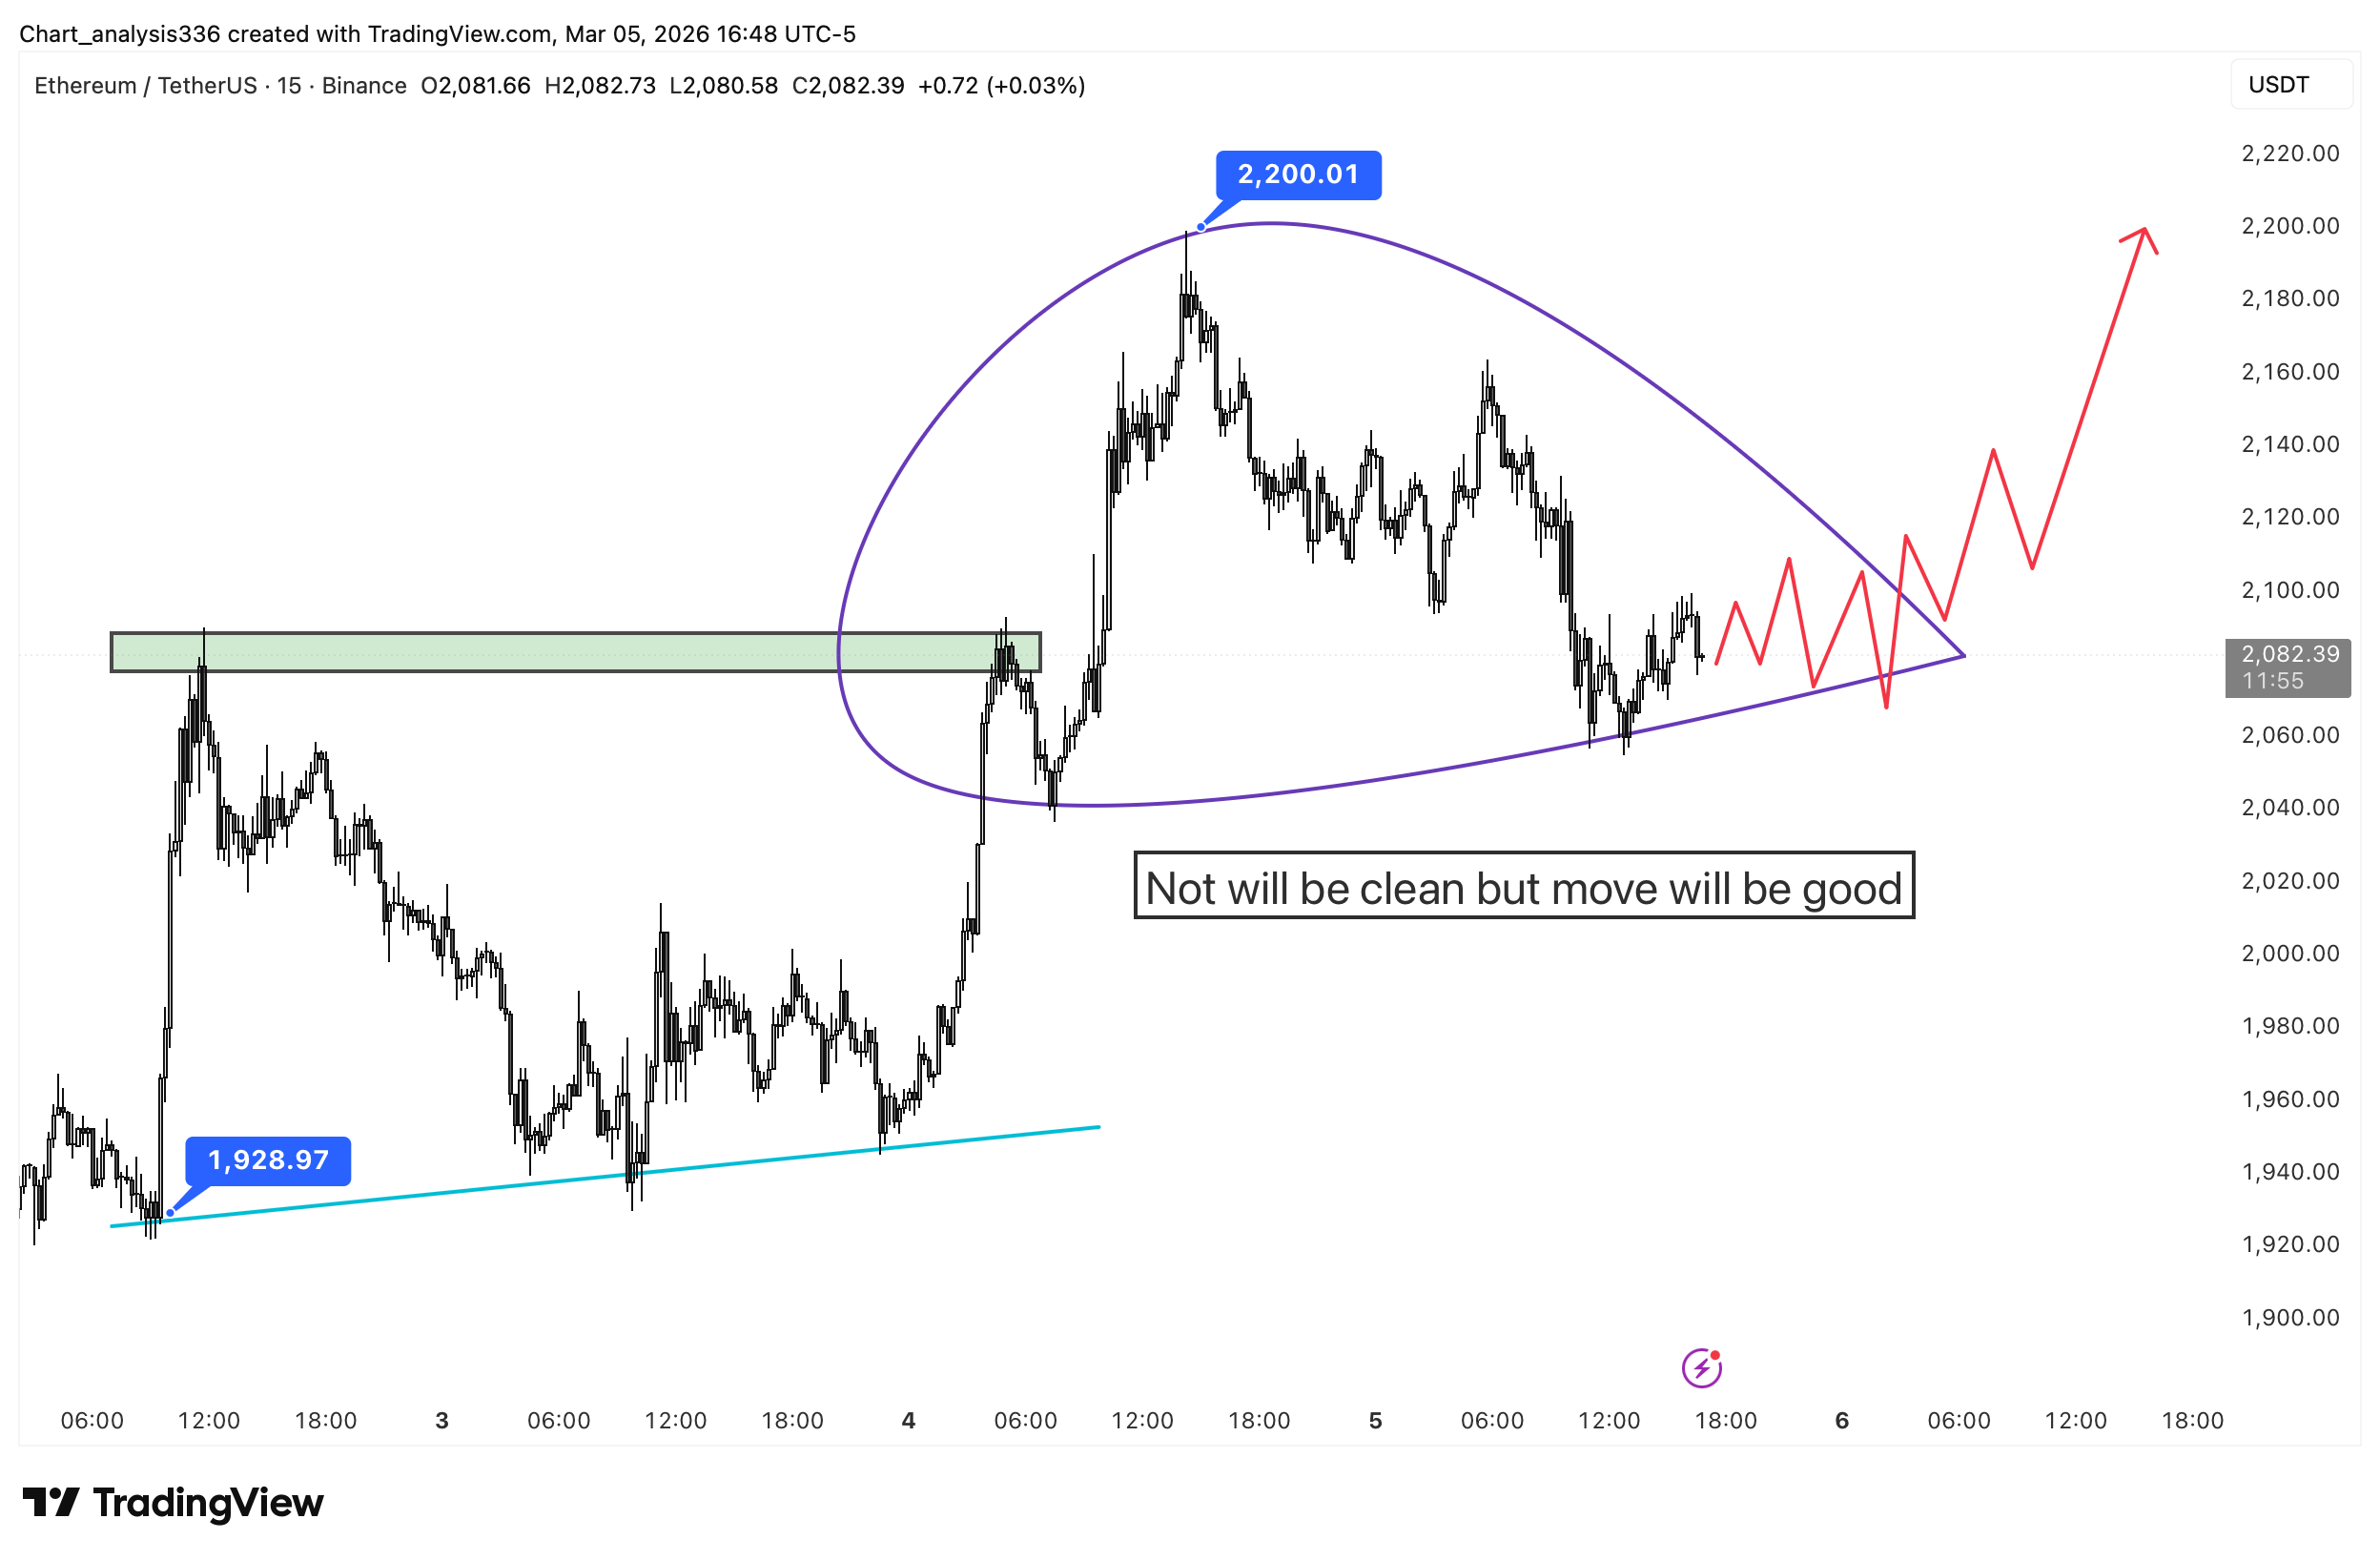
On this 15m $ETH chart the big story is the transition from impulse → distribution → compression. You can see a clean expansion leg that ran from the ~1,930 base into the ~2,200 peak, and that move left behind two important footprints: (1) the market proved it can bid aggressively when liquidity is thin, and (2) it created a clear “memory zone” around the mid-2,0xx area where price later keeps coming back to negotiate. After tagging ~2,200, price didn’t instantly collapse instead it bled into a rounded/arc-style structure (that purple curve) which usually signals the market is rotating from trend trading into position reshuffling. That’s why the candles become messy and mean-reverting: buyers are still defending, but they’re not strong enough (yet) to push a clean continuation, while sellers keep fading rallies into nearby supply. In simple terms: the trend energy from the pump is cooling, but it hasn’t flipped bearish structurally unless the base gives way.
The most actionable detail here is where price is being “accepted.” Right now ETH is hovering around the 2,080 area (your chart reads ~2,082), which is acting like a pivot: it’s close enough to prior congestion that both sides can justify trades there. Below, the local swing support looks to be around 2,060–2,070 (the rising lower boundary/ascending support in purple), and that’s the line that keeps the structure alive. Every dip that holds above that area builds higher lows and forces shorts to cover into bounces. Above, the nearest friction is the 2,110–2,140 band (multiple reactions inside the arc), then 2,160 and the prior shelf near 2,180 before the obvious magnet at 2,200. If ETH can reclaim and hold above that 2,110–2,140 region for even a couple of 15m closes, it shifts the tape from “range chop” into “re-accumulation,” because it means buyers are no longer only defending lows they’re starting to absorb sell pressure at higher prices.
So the professional read is: expect the move to be good, but not clean exactly because you’re coming out of compression. In these rounded-compression setups, the breakout often comes after a few fake pushes both ways as liquidity gets harvested: quick wicks below support to trigger stops, then a snap back; or a poke above resistance that fails once before the real expansion. The bullish roadmap is valid as long as ETH keeps printing higher lows above ~2,060–2,070 and doesn’t get accepted back under that rising base; if that support holds, the path of least resistance gradually tilts up toward 2,140 first, then a retest of 2,180 and the 2,200 high becomes realistic. The bearish invalidation is simple: a clean breakdown and acceptance below that ascending support (not just a wick) would likely drag price back into the prior value area and reopen downside toward the next liquidity pocket under the range. Until then, this is a “patience” chart not because nothing is happening, but because the market is building the conditions for the next directional leg.
#MarketRebound #LONG✅ #oppertunity