is the simple technical analysis 📊
Chart Pattern
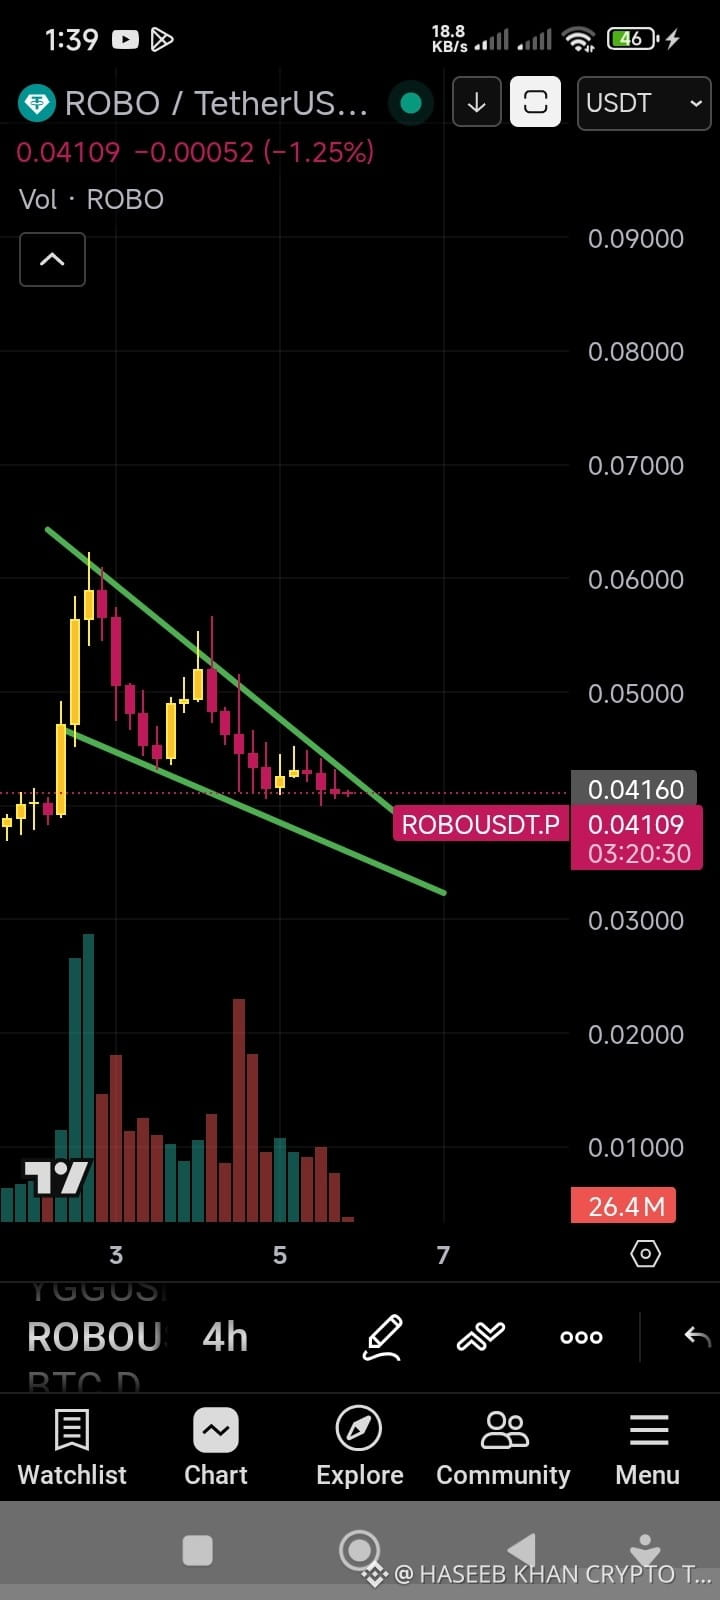
Your chart shows a falling channel / descending wedge.
Price is moving between two downward trend lines.
Current price ≈ 0.041
Market trend is still bearish (downtrend).
Key Levels
Support:
0.040
0.037
0.033 (strong support)
Resistance:
0.045
0.050
0.055
What Can Happen
📉 Bearish Scenario
If price breaks 0.040 support, next targets:
0.037
0.034
📈 Bullish Scenario
If price breaks the upper trendline with volume:
Target 0.046
Then 0.050
Important Signal
Right now candles are small and volume is decreasing → this means breakout is coming soon ⚡
My Opinion
Short term: sideways to slightly down
Big move when channel breaks
✅ Safe trade idea
Buy after breakout above 0.045
Or buy near 0.037 support
If