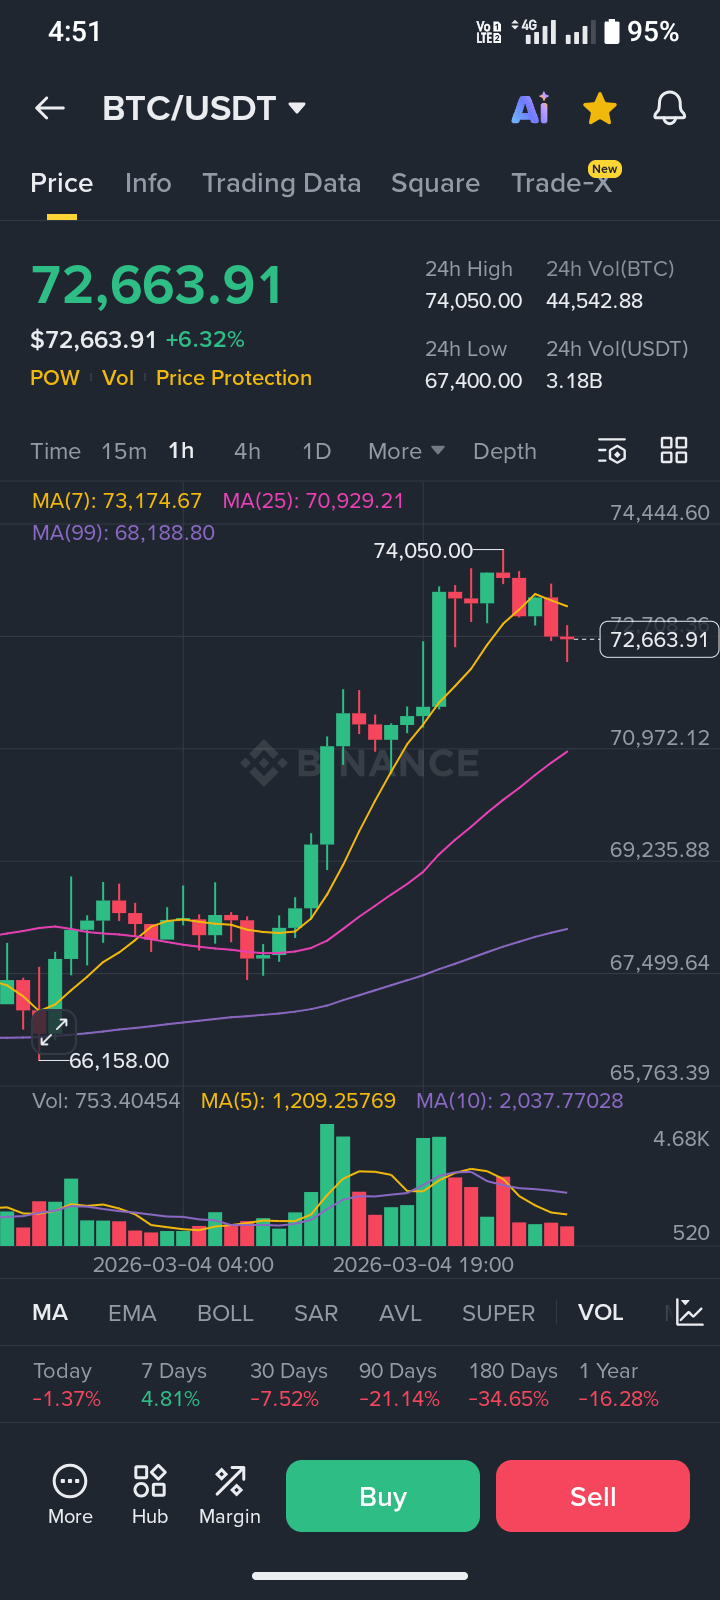
At the time of analysis, Bitcoin (BTC/USDT) is trading around $72,600 after a strong bullish expansion that pushed price toward the $74,000 resistance zone.
The market recently printed a sharp impulsive move from $66K → $74K, confirming strong buyer dominance. However, current price action now suggests short-term cooling.
📊 Market Structure Analysis (1H)
✅ Trend: Bullish
✅ Structure: Higher High formation
⚠️ Current Phase: Healthy Pullback / Consolidation
Key observations:
Price rejected near $74,050 resistance
Small red candles forming → momentum slowing
Price holding above MA25 (~70.9K) shows trend still intact
Volume declining after breakout → normal profit-taking phase
This behavior usually signals continuation setup, not reversal.
🎯 Trade Scenarios
🟢 Bullish Continuation Setup
Entry Zone: $71,800 – $72,200
Targets:
TP1: $73,800
TP2: $75,200
TP3: $77,000
Stop Loss: $69,900
👉 As long as BTC holds above $70K support, buyers remain in control.
🔴 Bearish Pullback Scenario
If price loses $70,000, expect deeper retracement toward:
$68,500 (MA99 support)
Liquidity zone near previous breakout base
This would still remain a macro bullish correction.
🧠 Smart Money Insight
After strong rallies, institutions often:
Take partial profits
Create sideways movement
Re-accumulate before next expansion
Current structure looks like re-accumulation, not distribution.
⚠️ Risk Reminder
Crypto markets remain highly volatile. Always manage risk and avoid over-leveraging — patience wins more trades than chasing candles.
📌 Final Thought
Bitcoin is not showing weakness yet — only a pause after momentum expansion. The next decisive move will likely come after liquidity builds around the $72K range.
Are you expecting BTC breakout above $75K or a deeper retest first?
#Bitcoin #BTC #CryptoMarket #BinanceSquare #marketnextmove

Full trade Setup by Hassan Bilal official