Here’s a strong, no-nonsense take on $BTC right now — with the latest data, price context, and key levels — so you can decide whether holding shorts makes sense.
Market snapshot (as of early March 2026):
BTC reclaimed above ~$70,000 after recent volatility, rallying on risk appetite despite macro uncertainty. �
MarketWatch
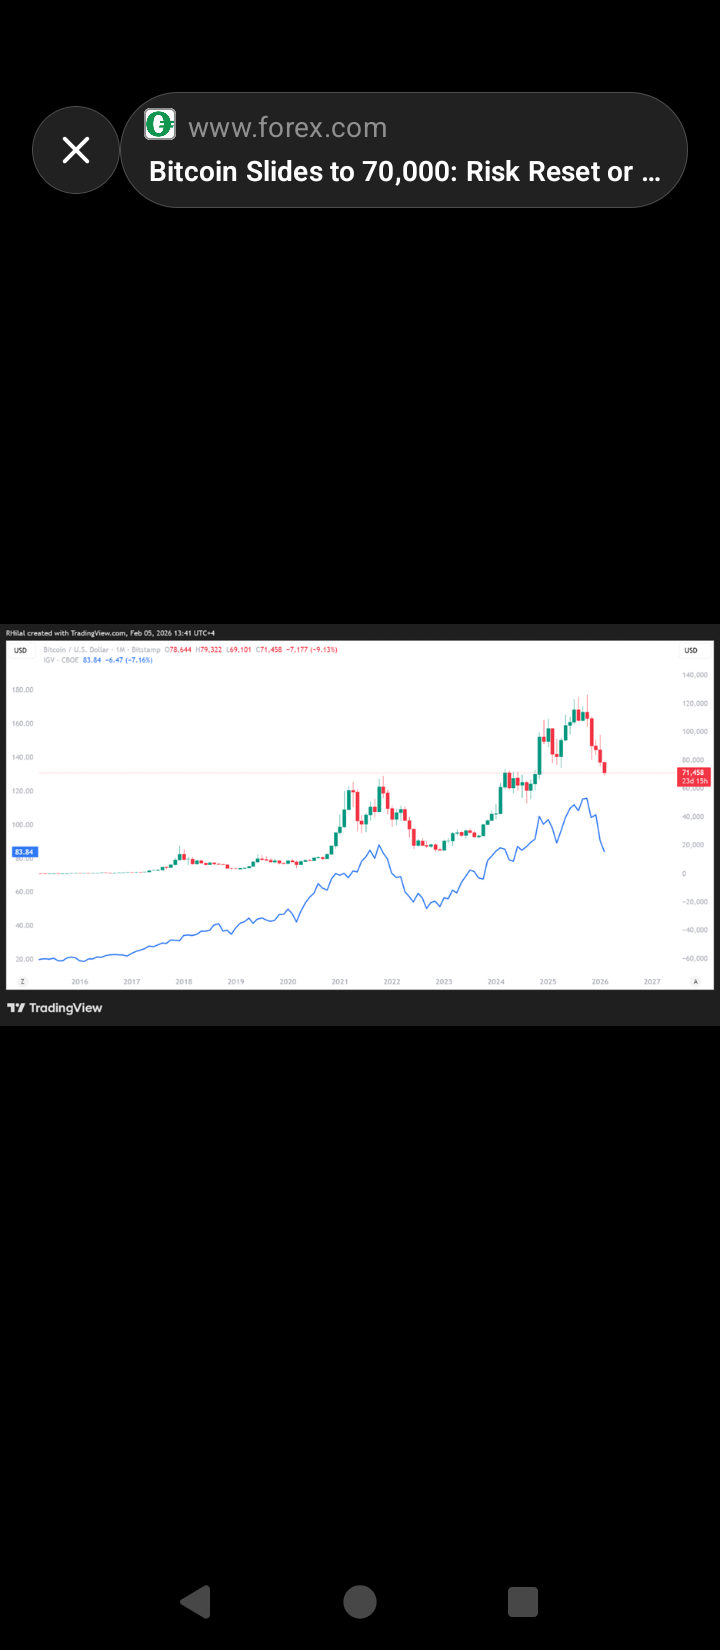
Price is still down significantly from its October 2025 ATH (~$126K) → meaning the correction is not over structurally. �
Barron's
Investors poured ~$1B into BTC recently, showing faith despite a long drawdown. �
The Economic Times
Past sharp drops showed volatility tied to geopolitical shocks, suggesting macro risk can still drive swings. �
The Economic Times
📌 Bottom line: We’re not in a clean uptrend yet — the bounce may be counter-trend unless key levels flip.
🧠 TECHNICAL LEVELS THAT MATTER
Based on recent price behavior and structural levels from multiple analyses:
🔑 Key Support Zones
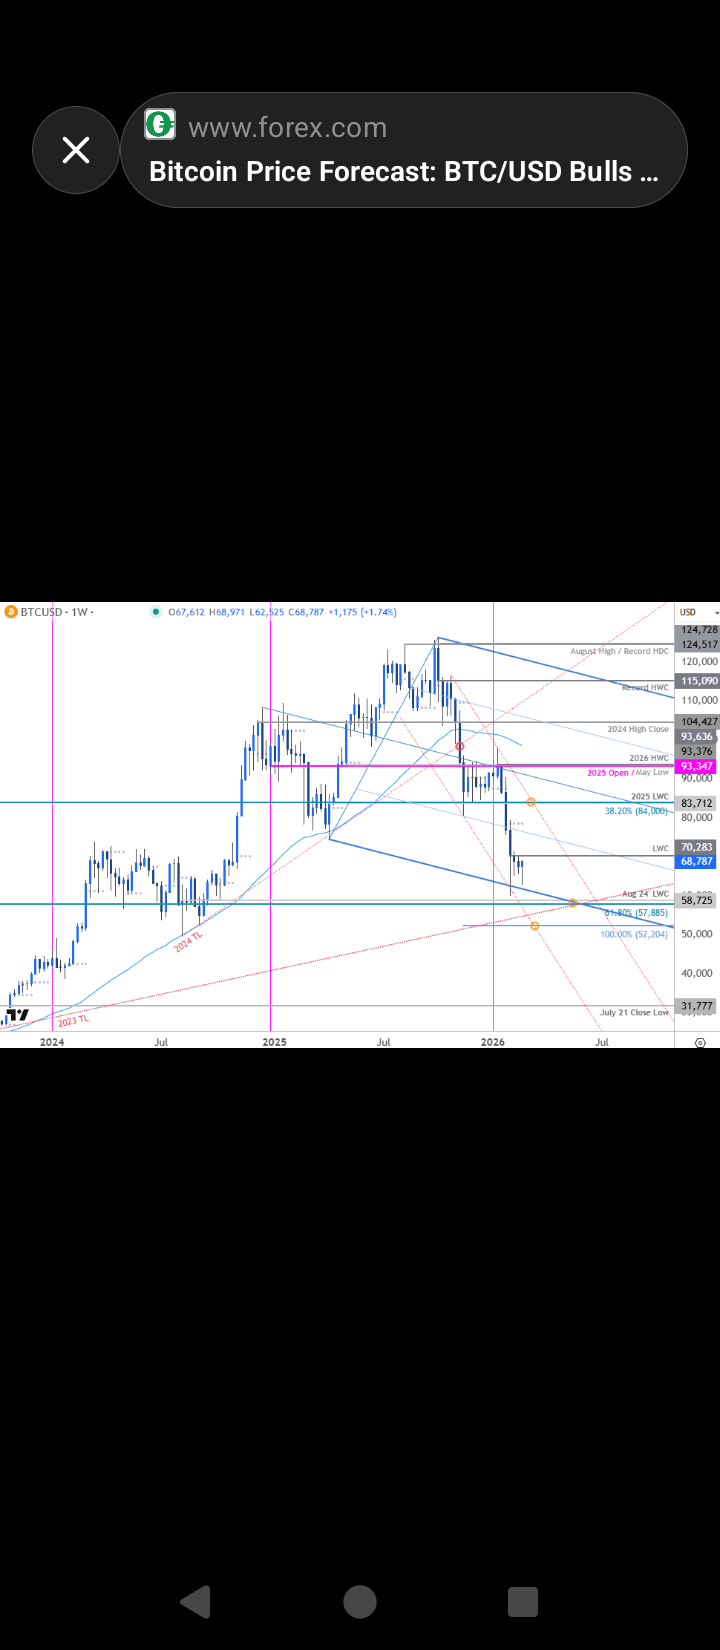
$62,000–$64,000 — major multi-day support (break below = deeper correction risk). �
bittimexchange
$58,000–$60,000 — deeper tactical downside if selling pressure resumes. �
bittimexchange
🚧 Key Resistance Zones
$69,000–$70,000 — psychological barrier. Need to flip above for bullish conviction. �
bittimexchange
$73,000–$75,000 — confirmation zone that could shift macro bias. �
Capital.com
📊 Indicators
Short-term momentum is neutral-bearish, RSI shows lack of strong buy pressure. �
Capital.com
Holding above $66K now maintains range play, but failure risks retesting deeper.
📈 Strong Opinions — Clear Direction 🔥
1. Correction is still playing out (not finished)
Longer timeframes show BTC is still beneath major moving averages and risk remains elevated. Many analysts and models put BTC in a bearish/sideways correction phase until a structural breakout above resistance. �
Capital.com
If price breaks below $62K next:
➡️ Odds of deeper pullback increase — $58K or lower possible. �
bittimexchange
If price closes and holds above ~$70K:
➡️ Could begin an accumulation or relief rally phase.
2. Hold Shorts Strategically — But Don’t Be Greedy
If you’re currently short:
✅ Add stop-loss above ~$72,000 — this area invalidates the short bias.
❌ Do not hold shorts blindly if BTC takes out $70K with volume.
Smart move:
👉 Scale smaller profits near $69K–$70K
👉 Protect gains near $66K–$64K supports
👉 If momentum breaks below $62K — consider adding aggressively
3. Bigger Picture — Cycles Matter
History suggests post-ATH corrections can last many months — even up to a year — before broad bottoms form. This time has shown a ~40–50% drawdown already. �
Cycles don’t always repeat perfectly, but market structure right now is not clearly bullish until a breakout is validated.
📷 Quick Visual Overview (Text-Only Price Levels)
Copy code
Resistance Zones (Bear Breakout Invalidation)
🏁 73,000 — 75,000 | Strong Breakzone
🚀 69,000 — 70,000 | Psychological test
Price Range
🔁 65,000 — 69,000 | Range/off trend right now
Support Zones (Bull Setup Protection)
🛡️ 62,000 — 64,000 | Key defensive support
🧱 58,000 — 60,000 | Riskier deeper support
🧠 Conclusion — What You Do
Short Bias Valid
✔️ While BTC remains under $70K
✔️ Until structure flips above resistance
Keep cover tight
⚠️ If BTC sustains above $72K with volume → shorts get invalidated
Watch support zones
🟦 $62K break = trend extends, add shorts / ride deeper
Higher time frames
⏳ BTC still in large correction range from ATH, not a clear trend reversal yet.
If you want, I can generate your exact chart levels labeled or a multi-timeframe analysis with entry/exits (even for H1–W1 frames) tailored to your risk tolerance.

#StockMarketCrash #USCitizensMiddleEastEvacuation #XCryptoBanMistake #GoldSilverOilSurge #VitalikETHRoadmap