Most traders think symmetrical triangles are reliable. The data says otherwise and knowing the difference can save your account.
What Is a Symmetrical Triangle?
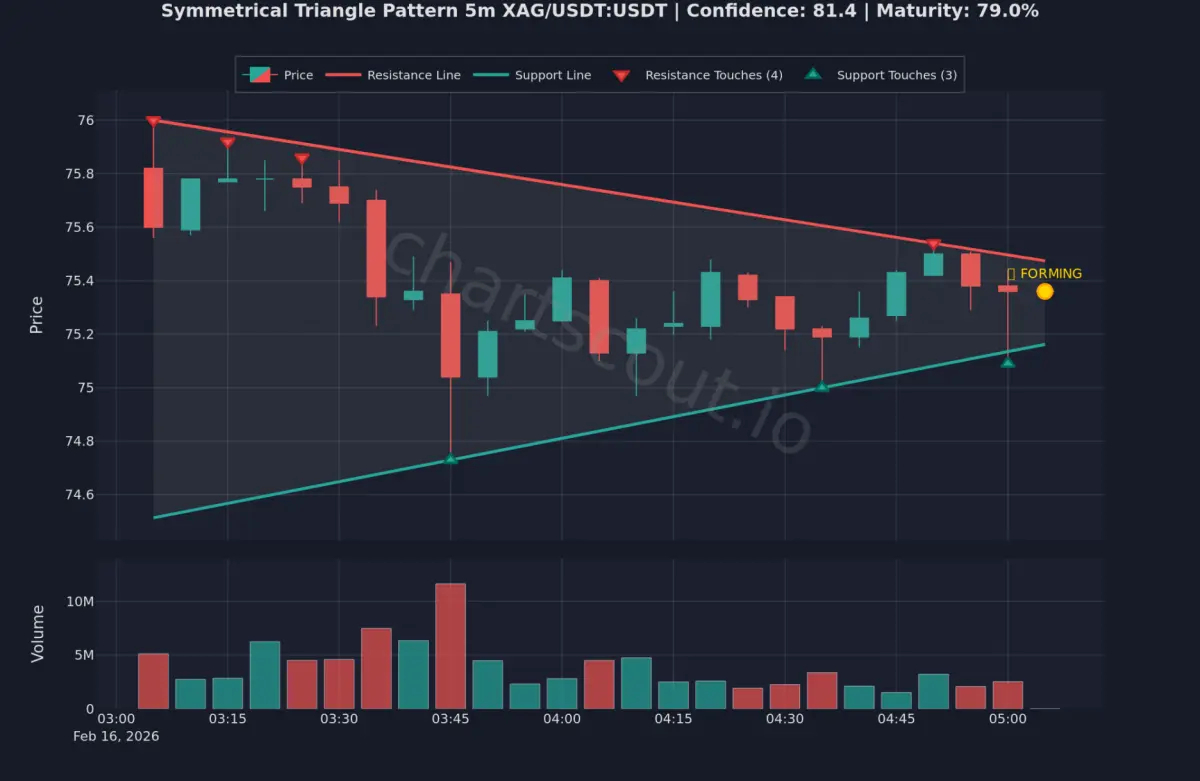
A symmetrical triangle forms when price creates lower highs and higher lows, compressing into a tightening range. The upper trendline descends. The lower trendline rises. Neither buyers nor sellers dominate until one side breaks.
You need at least 5 touch points (3 on one trendline, 2 on the other) and a formation time of 3 weeks to 3 months on daily charts. In crypto's 24/7 market, this compresses to 7–10 days. On 15-minute charts, a triangle can fully form in a few hours.
What Bulkowski's Research Actually Shows
Thomas Bulkowski studied 3,000+ trades in his Encyclopedia of Chart Patterns (3rd Edition). The results are sobering:
✓ Symmetrical triangles rank 36th out of 39 patterns for upward breakout performance
✓ Average rise after upward breakout: 34%
✓ Average decline after downward breakout: only 12%
✓ Break-even failure rate: 25% up, 37% down
✓ More than 1 in 3 bearish breakouts fail to drop even 5%
The popular "70% success rate" you see in trading content? It doesn't hold up to scrutiny.
The Best Trade Is Often the Failed Breakout
Here's the counterintuitive finding most guides skip entirely:
In bull markets, 48% of downward breakouts from symmetrical triangles reverse and bust. When this happens, the average gain is 52% higher than the 34% average from a normal upward breakout.
How to trade a bust:
Wait for the initial breakdown below the lower trendline
Watch for price to close back above the upper trendline
Enter on that close with volume confirmation
Stop-loss below the swing low of the failed breakdown
Target 52% or trail with a moving average
The bust setup beats the standard breakout statistically.
Volume Is Non-Negotiable
Volume declines during formation 84–86% of the time this is almost a requirement for a valid triangle. On the breakout, you want volume 50%+ above the 30-day average. No spike = no conviction = no trade.
Rising OBV (On-Balance Volume) during formation signals accumulation and predicts upside breakouts. Falling OBV signals distribution watch for the bust opportunity if a breakdown occurs.
The Asymmetry You Must Respect
Upward Breakouts: 34% average move, 25% failure rate, 58% measured move hit rate
Downward Breakouts: 12% average move, 37% failure rate, 36% measured move hit rate
Shorting symmetrical triangle breakdowns is statistically one of the weakest trades in technical analysis. Use breakdowns as bust-reversal alerts instead.
Key Takeaways
✓ Symmetrical triangles are neutral - prior trend + OBV + RSI determines direction
✓ Busted downward breakouts (48% rate) average 52% gains
✓ Only trade with volume confirmation - 50%+ spike on breakout candle
✓ Risk max 1–2% per trade - consecutive losers are statistically normal
✓ Tall triangles near yearly lows massively outperform (182% avg vs 105% mid-range)
Full Article: https://chartscout.io/symmetrical-triangle-pattern-crypto
__________________________________________________________
Disclaimer: This is educational content only, not financial advice. Crypto trading involves substantial risk. Always do your own research and never invest more than you can afford to lose.
---------------------------------------------------------------------------Statistical data sourced from Thomas Bulkowski's Encyclopedia of Chart Patterns, 3rd Edition. Crypto markets may see larger moves but also higher false breakout rates (62–65% reliability).
#SymmetricalTriangle #tradingeducation #ChartScout #TechnicalAnalysiss #ta