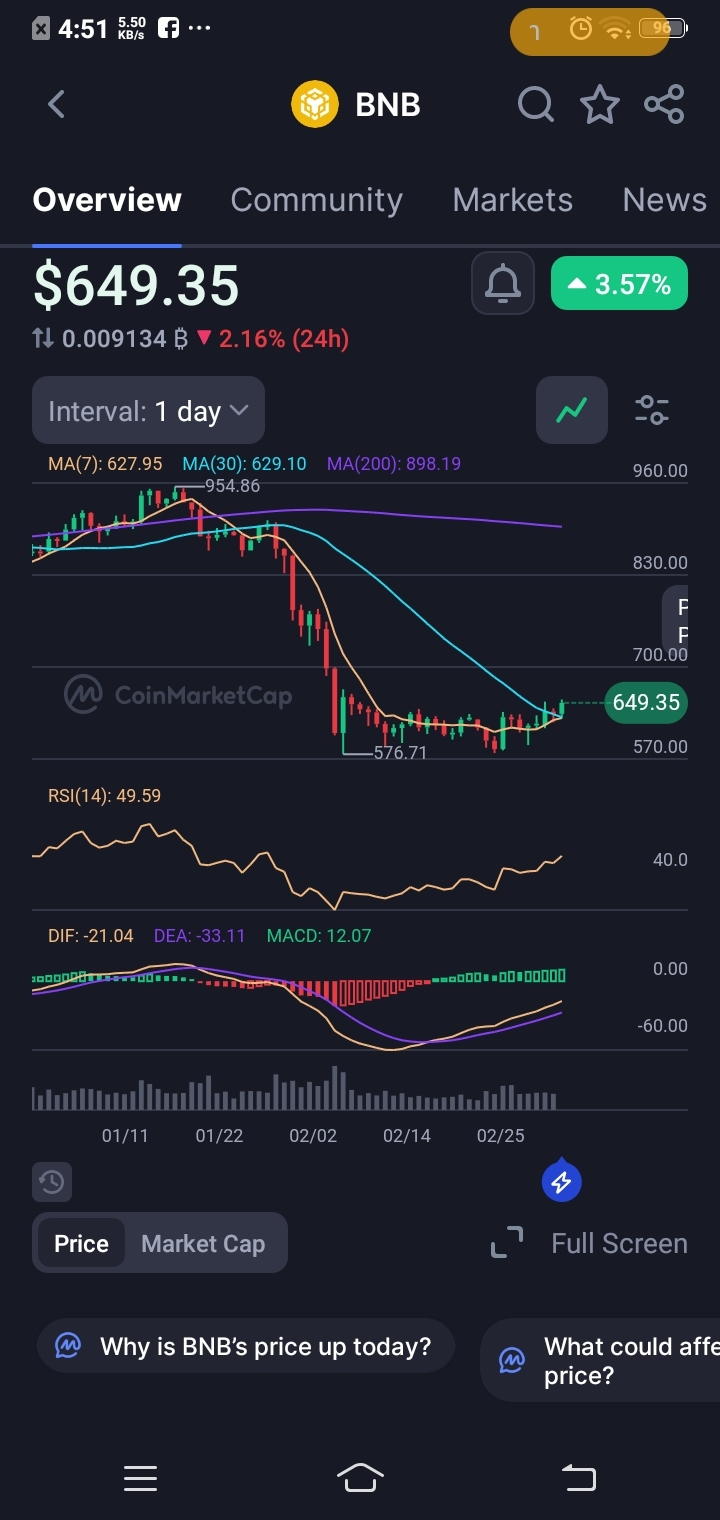
$BNB is showing signs of life after a prolonged downtrend. Price has reclaimed both the 7 and 30-day moving averages, currently trading at $649.35. This often signals a shift in short-term momentum. The MACD just delivered a bullish crossover (DIF crossing above DEA), and the histogram is printing its first positive bars. This suggests the selling pressure is exhausting and buyers are attempting to establish a floor.
Where Are Buyers & Sellers Active?
· Buyers are stepping in near the $627–$630 zone (coinciding with MA(7) & MA(30)), treating this as a new support area.
· Sellers remain active near the $700–$720 range, a previous demand zone that now acts as resistance. A break above this could trigger a move toward the next liquidity pool near $830.
· The 200 MA ($898.19) is the long-term bearish divider—below it, the structure is still a downtrend.
What Confirms the Move
A confirmed move higher requires a daily close above $670 with increasing volume. This would signal that buyers are absorbing supply and momentum is building. The RSI at 49.59 has room to run before becoming overbought, supporting further upside if volume confirms.
What Invalidates the Idea
If $BNB loses $627** on a daily close, the bullish setup is invalid. That would trap recent buyers and likely lead to a retest of the **$570 range low. The structure remains fragile until we clear the 200 MA.
Hashtags
#BNB #TechnicalAnalysis #SmartTrading #CryptoStrateg #Binance