📊 Daily Crypto Market Analysis
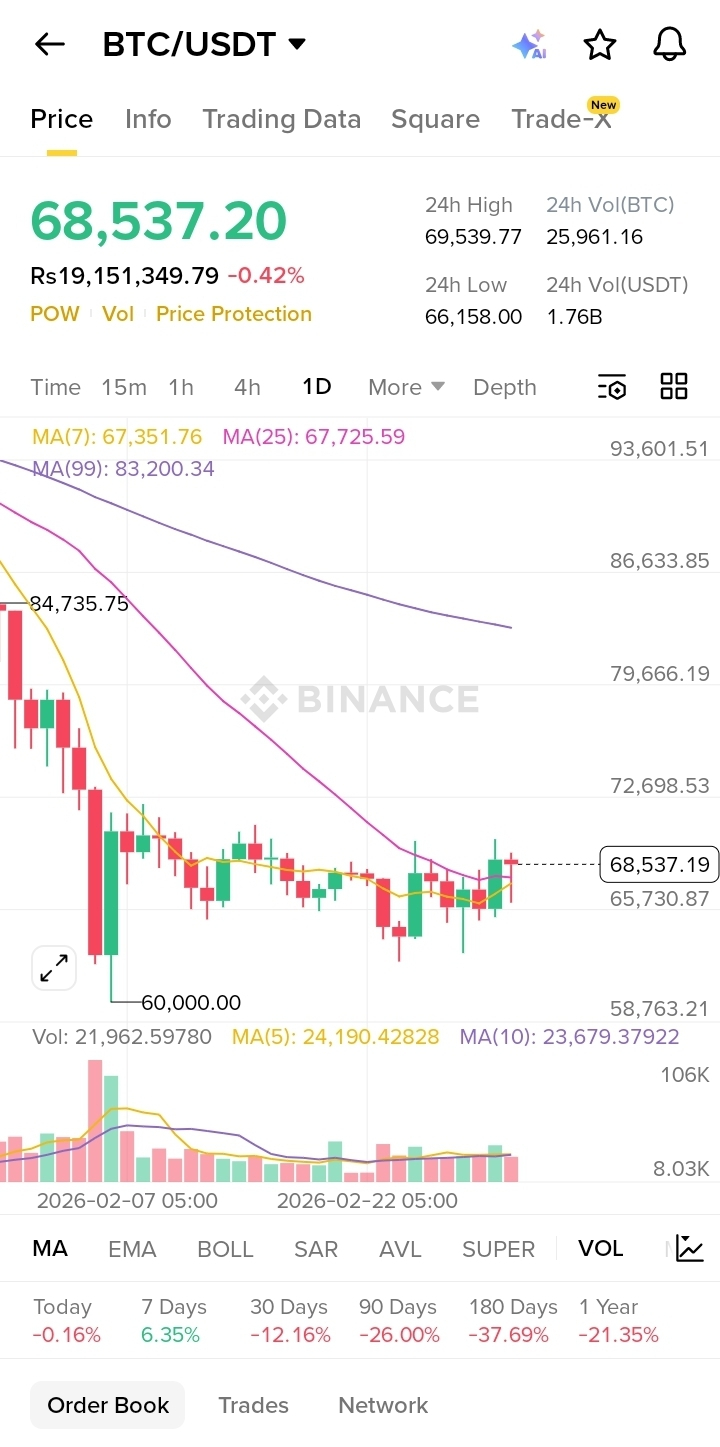
Pair: BTC/USDT
Date: 4 March 2026
Timeframe: 1D (Binance)
🟡 Market Overview
Current Price: $68,537
24H High: $69,539
24H Low: $66,158
24H Change: -0.42%
24H Volume: 25,961 BTC
Market is showing sideways consolidation after a strong drop, with slight recovery momentum.
🔍 Technical Analysis (1D)
📉 Moving Averages
MA(7): 67,351
MA(25): 67,725
MA(99): 83,200
Price is trading:
Above MA(7) ✅ (short-term strength)
Near MA(25) ⚖️ (decision zone)
Far below MA(99) ❌ (long-term bearish structure)
This suggests short-term bounce inside a larger downtrend.
📊 Market Structure
Major dump from 84,700 → 60,000
Strong support formed around $60,000
Current price consolidating between 65,000 – 70,000
Market is building a possible accumulation range.
🟢 Key Levels to Watch
Support:
66,000
63,500
60,000 (major support)
Resistance:
69,500
72,000
79,600 (major resistance zone)
🔥 Scenarios for Traders
🟢 Bullish Case:
If BTC breaks and closes above 69,500, next targets:
72,000
75,000
Momentum confirmation needed with strong volume.
🔴 Bearish Case:
If BTC loses 66,000 support, downside targets:
63,500
60,000 retest
Break below 60K could restart strong bearish pressure.
📈 Volume Insight
Volume is moderate. No explosive breakout volume yet.
Breakout will require a volume spike.
💡 Trading Strategy Ideas
Range trading between 66K – 69K (low leverage recommended)
Wait for daily close confirmation before breakout trades
Use strict stop-loss (1–2% risk per trade)
🧠 Market Bias
Short-term: Neutral to Slightly Bullish
Mid-term: Bearish
Long-term: Bearish until price reclaims 83K MA(99)
⚠️ Risk Reminder: Market still in recovery phase. Avoid over-leverage.#BTC走势分析