Key Market Drivers for $BTC
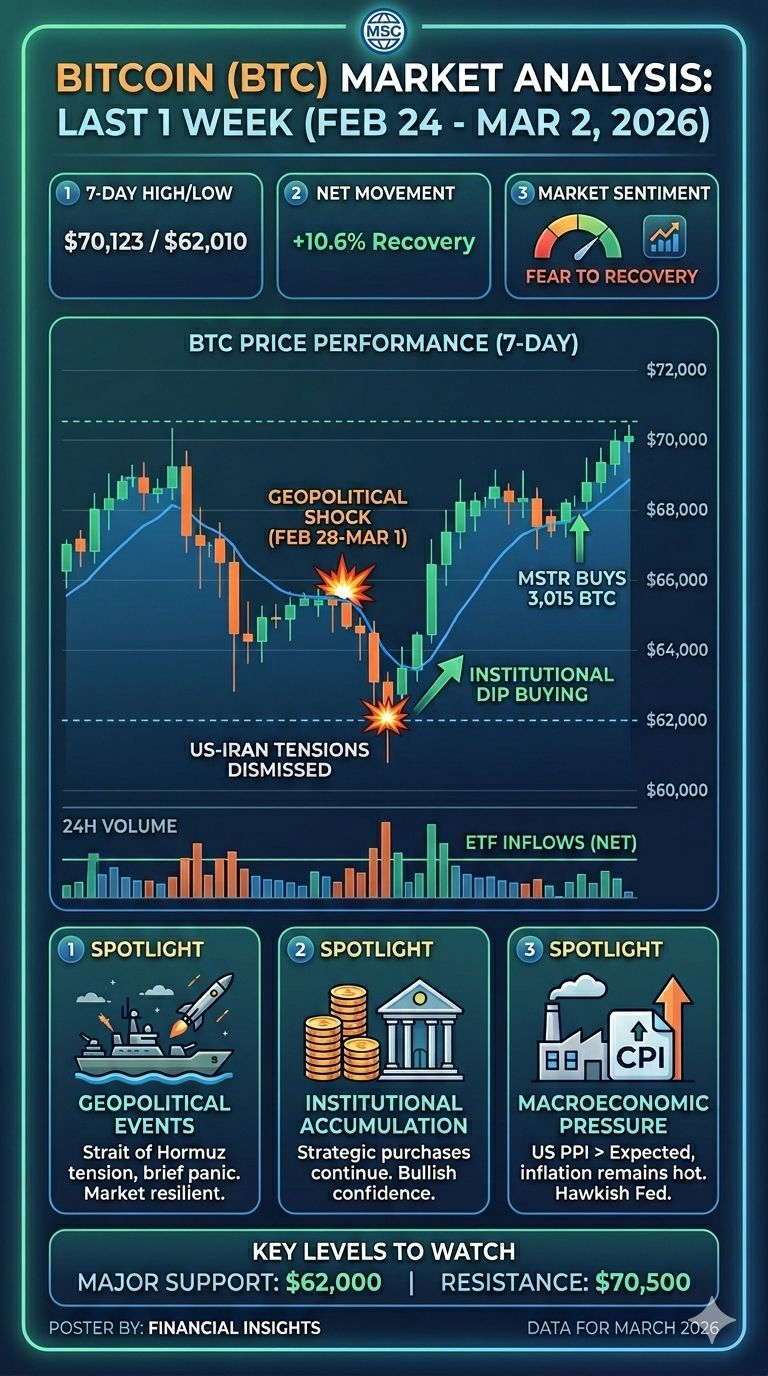
Geopolitical Shockwaves: Over the weekend (March 1–2), reports of escalated tensions between the U.S. and Iran caused a brief dip toward $63,000. However, BTC proved resilient, avoiding a full-blown "panic sell" as traders dismissed "World War III" narratives.
Institutional "Dip Buying": The recovery back toward $69,000 was largely fueled by big players. Notably, Strategy Inc. (MSTR) reported acquiring 3,015 BTC this past week, bringing their total holdings to over 720,000 BTC.
Macro Economic Pressure: Hotter-than-expected U.S. PPI data (0.5% vs 0.3% expected) released on Friday signaled persistent inflation. This has led to a "hawkish" tilt, making investors wary that the Federal Reserve may delay interest rate cuts.
Technical Outlook: BTC is currently testing the $70,000 psychological level. Analysts suggest that a weekly close above $68,800 is necessary to break the current descending "bearish" structure that has persisted since the October 2025 highs.
What to Watch This Week
U.S. Unemployment Data (March 6): A key indicator for the Fed’s next move.
Oil Prices: If oil stays near $80 due to Strait of Hormuz tensions, rising inflation could pressure BTC prices downward.
ETF Inflows: Last week saw $1 billion in net inflows over three days; if this trend continues, it could provide the liquidity needed to clear $70,000.
Note: While some macroeconomists are forecasting a rally to $100,000+ later in 2026, the short-term remains sensitive to "risk-off" events in the Middle East.
#MrMuhammadSumon #IranUSTensions