The $MIRA /USDT pair on the 4-hour chart has captured the attention of traders as it tests key resistance levels. After a period of corrective price action, MIRA has found solid footing and is showing signs of a potential bullish reversal.
Key Technical Observations:
Support Zone Confirmed: The crucial support zone around $0.088 has proven to be a robust floor for the price. MIRA has repeatedly bounced off this level, demonstrating strong buying interest and preventing further downsides. This zone, marked in green, serves as a solid foundation for any potential upward move.
Resistance Test in Progress: MIRA is currently challenging a significant resistance level at $0.10. This horizontal level has historically acted as a barrier for the price, and a decisive break above it would signal a major shift in market sentiment.
Short Squeeze Zone (> $0.105): Above the immediate resistance, there is a potential "Short Squeeze Zone" identified beyond $0.105 (marked in orange). A sustained break above this level could trigger a rapid liquidation of short positions, accelerating the bullish momentum.
RSI Divergence: The Relative Strength Index (RSI) is showing a bullish divergence, forming higher lows while the price formed lower lows in the preceding correction. This indicates weakening bearish momentum and potential for a bullish reversal.
Moving Averages: MIRA is currently trading below the 50-day EMA and 200-day EMA on the 4-hour chart, indicating a downtrend in the short-to-medium term. However, a break above these moving averages would reinforce the bullish thesis.
Potential Scenarios:
Bullish Breakout: A strong 4-hour close above $0.10 with high trading volume would confirm a bullish breakout, potentially targeting the short squeeze zone above $0.105.
Rejection at Resistance: If MIRA fails to break $0.10 and turns down, it could retest the support zone at $0.088.
Conclusion:
MIRA is at a critical juncture. While the broader market sentiment remains influential, the technical indicators for MIRA are starting to show bullish promise. Traders will be closely monitoring the $0.10 resistance level and the $0.088 support zone for confirmation of the next major move. A break above $0.10, especially with confirmation from other indicators and increased volume, would be a strong bullish signal.
Image Analysis:
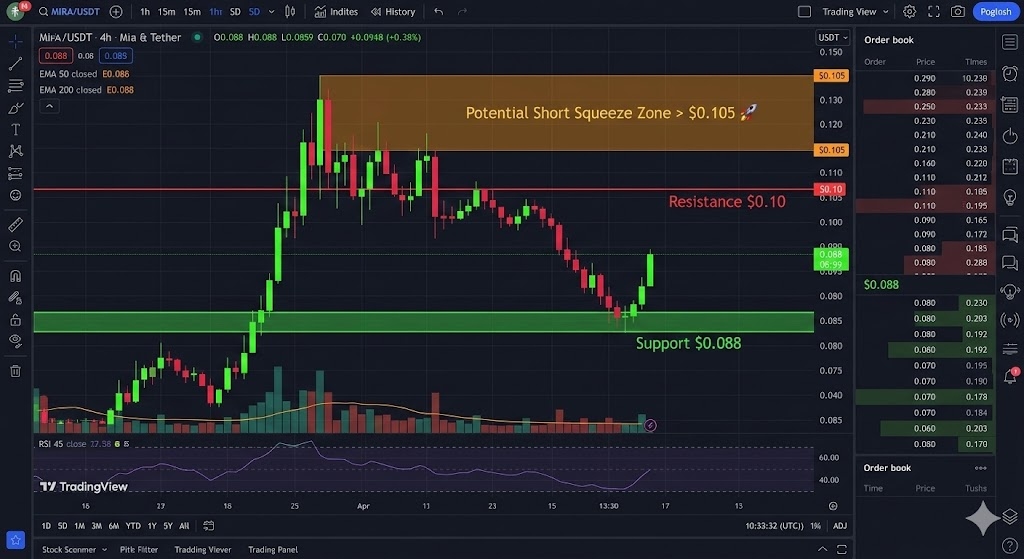
The image displays a TradingView technical analysis chart for MIRA/USDT on the 4-hour time frame. It clearly marks key technical elements discussed in the article:
Support Zone: Highlighted in green at $0.088, indicating strong buying interest.
Resistance: A horizontal red line at $0.10, showing the immediate barrier.
Short Squeeze Zone: A shaded orange region above $0.105, indicating a potential area for rapid price appreciation due to short coverings.
Moving Averages: The 50-day and 200-day EMAs are also visible.
RSI Indicator: The RSI chart at the bottom can be used to observe momentum and potential divergences.
For up-to-the-minute analysis and market discussions, follow leading crypto analytical platforms and social media channels.