$BTC #WhenWillCLARITYActPass #USJobsData #BTC100kNext? #BTC is trading around ~$67,800 – $68,000 (today’s live pricing).
Price is down ~25–30% from the 2025 peak near $126 K.
Volume has picked up modestly even as price struggles, suggesting continued activity but mixed conviction.
📉 Short-Term Technical Bias (Bearish Tilt)
1) Corrective Structure Forming
Analysts see a bear-flag pattern on daily charts — a consolidation after the recent drop. A break below the lower trend boundary could open a test of the $56 K region (about ~20% downside risk).
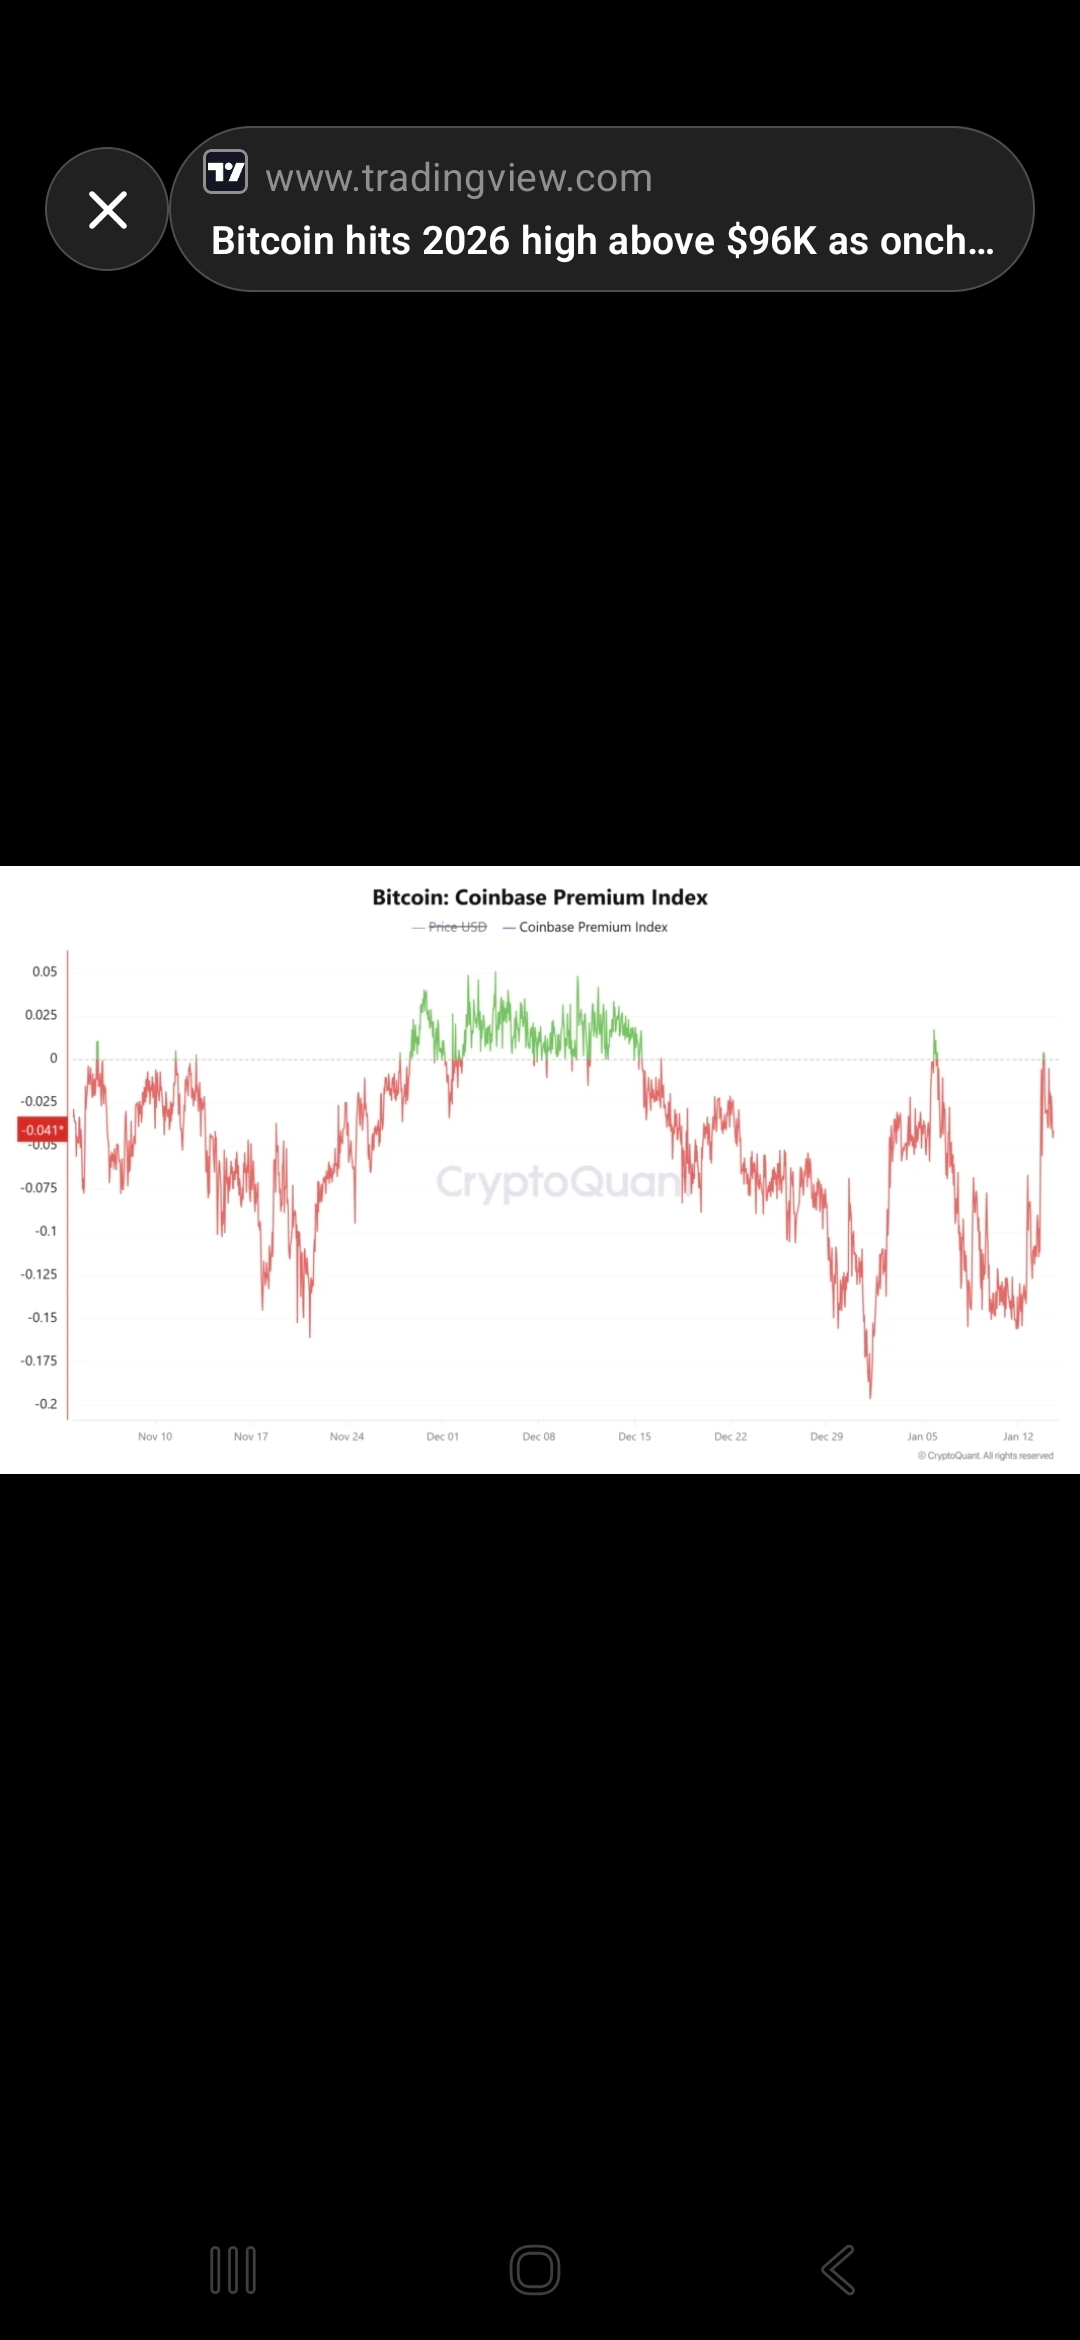
2) Weak Momentum & On-Chain Signals
Moving averages are pressuring price, and several on-chain indicators point to short-term downside risk with low bullish momentum.
3) ETF Outflows & Cautious Sentiment
Recent outflows from major Bitcoin ETFs signal institutional caution, potentially amplifying pressure if selling persists.
Key Near-Term Levels
⚠️ Support: ~$60 K (major demand area), then ~$56 K if $60 K breaks.
🛑 Resistance: ~$72 K–$75 K zone first; above this, ~$90 K if trend flips.
📈 Bullish Scenarios (If Momentum Recovers)
Sustained closes above $72 K–$75 K could invalidate the current bear flag and set up a run toward the $90 K+ zone.
Technical setups often see relief rallies emerge from oversold conditions — historically BTC bounces sharply after extended corrections.
📊 Macro / Cycle Context
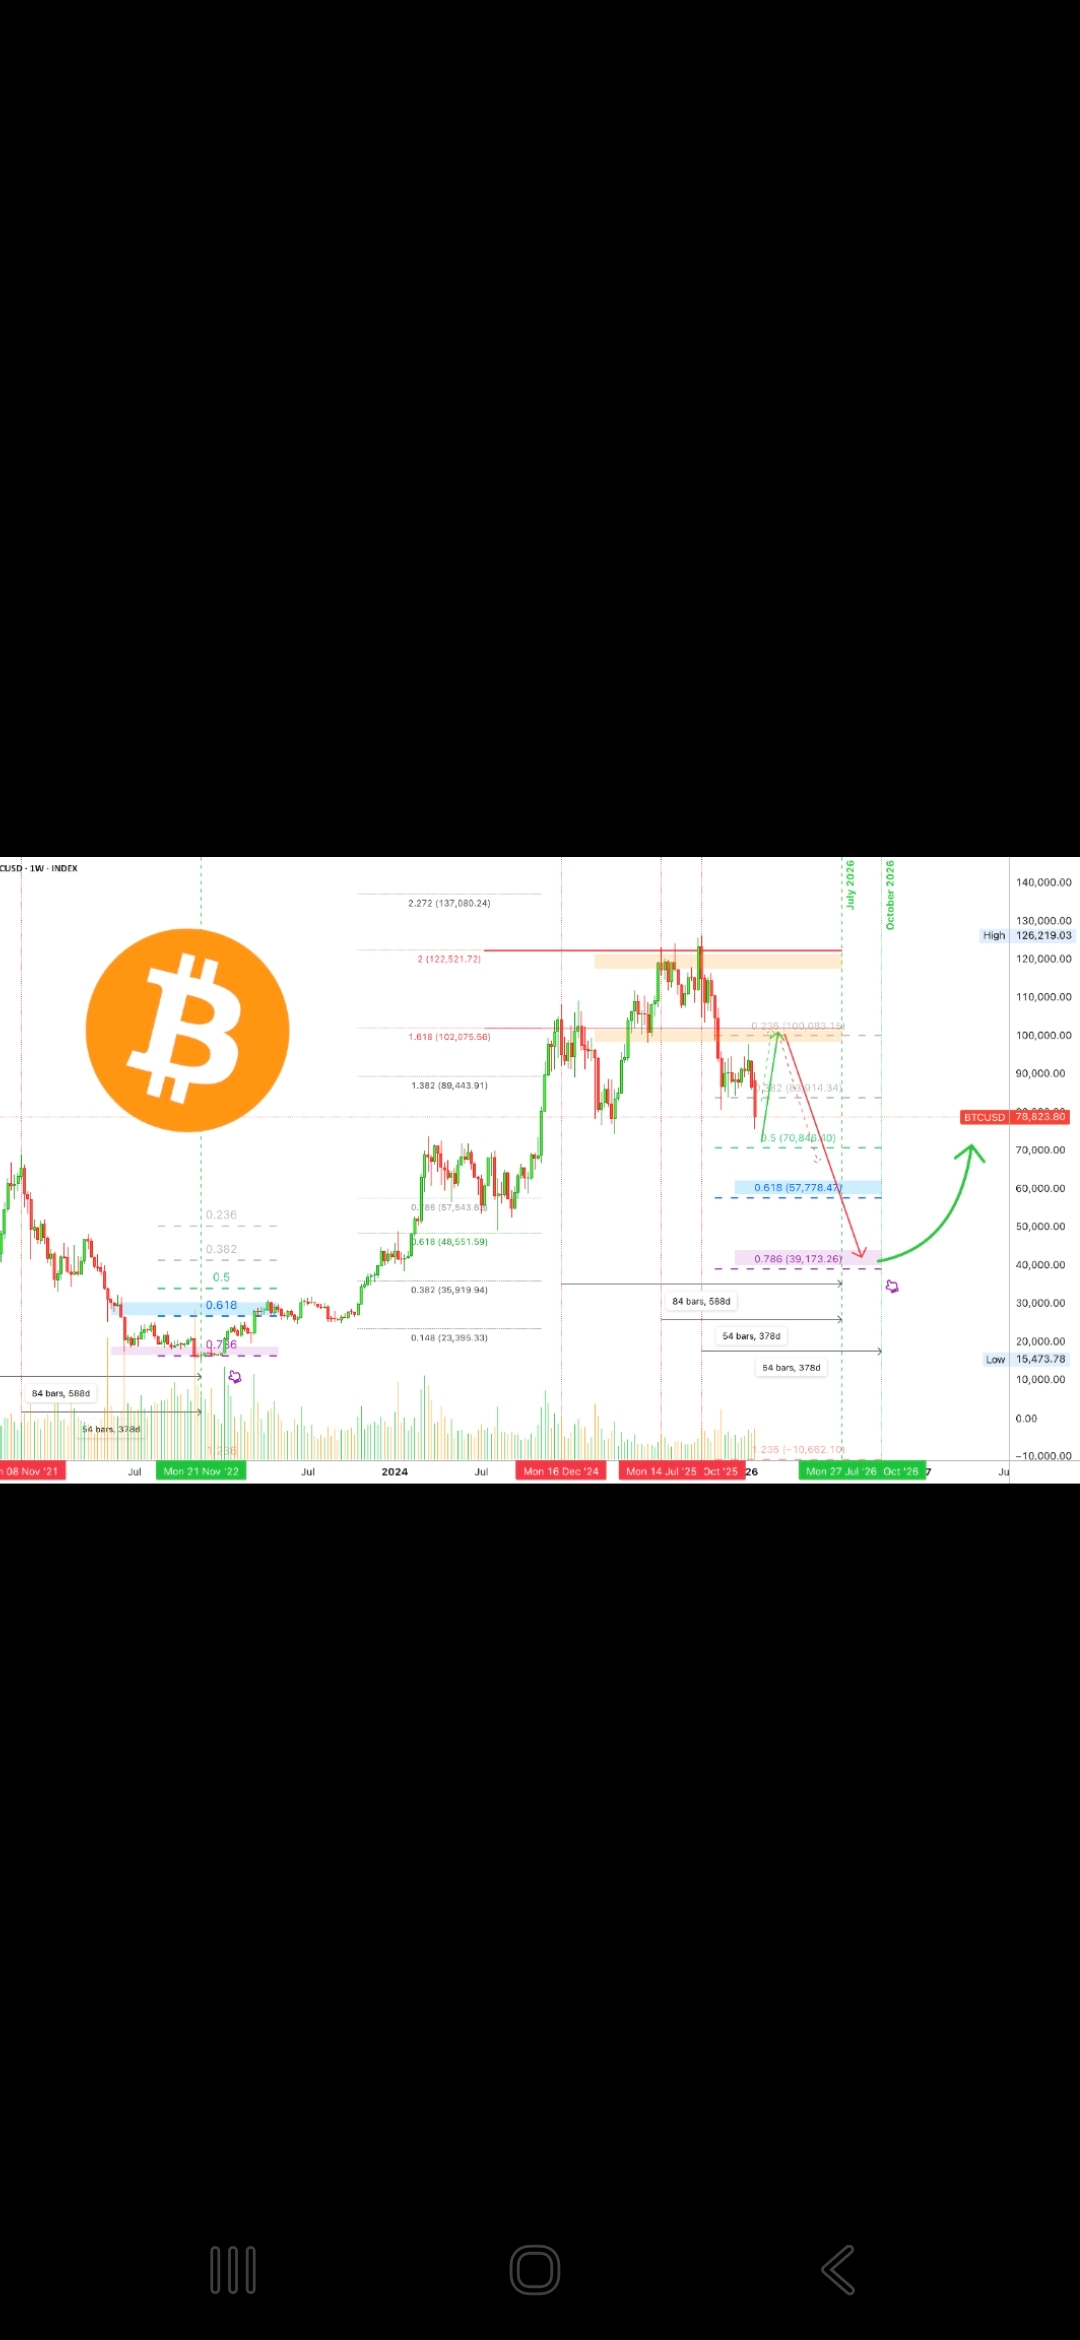

Long-term models and cycle projections are split: some see Bitcoin in the early stages of a new bull expansion, while others suggest the major cycle top may already be in the rear-view or extended into 2026.