If you’ve traded coins like RIVER, this PIPPIN structure should feel very familiar.
1. The Move Everyone Chased
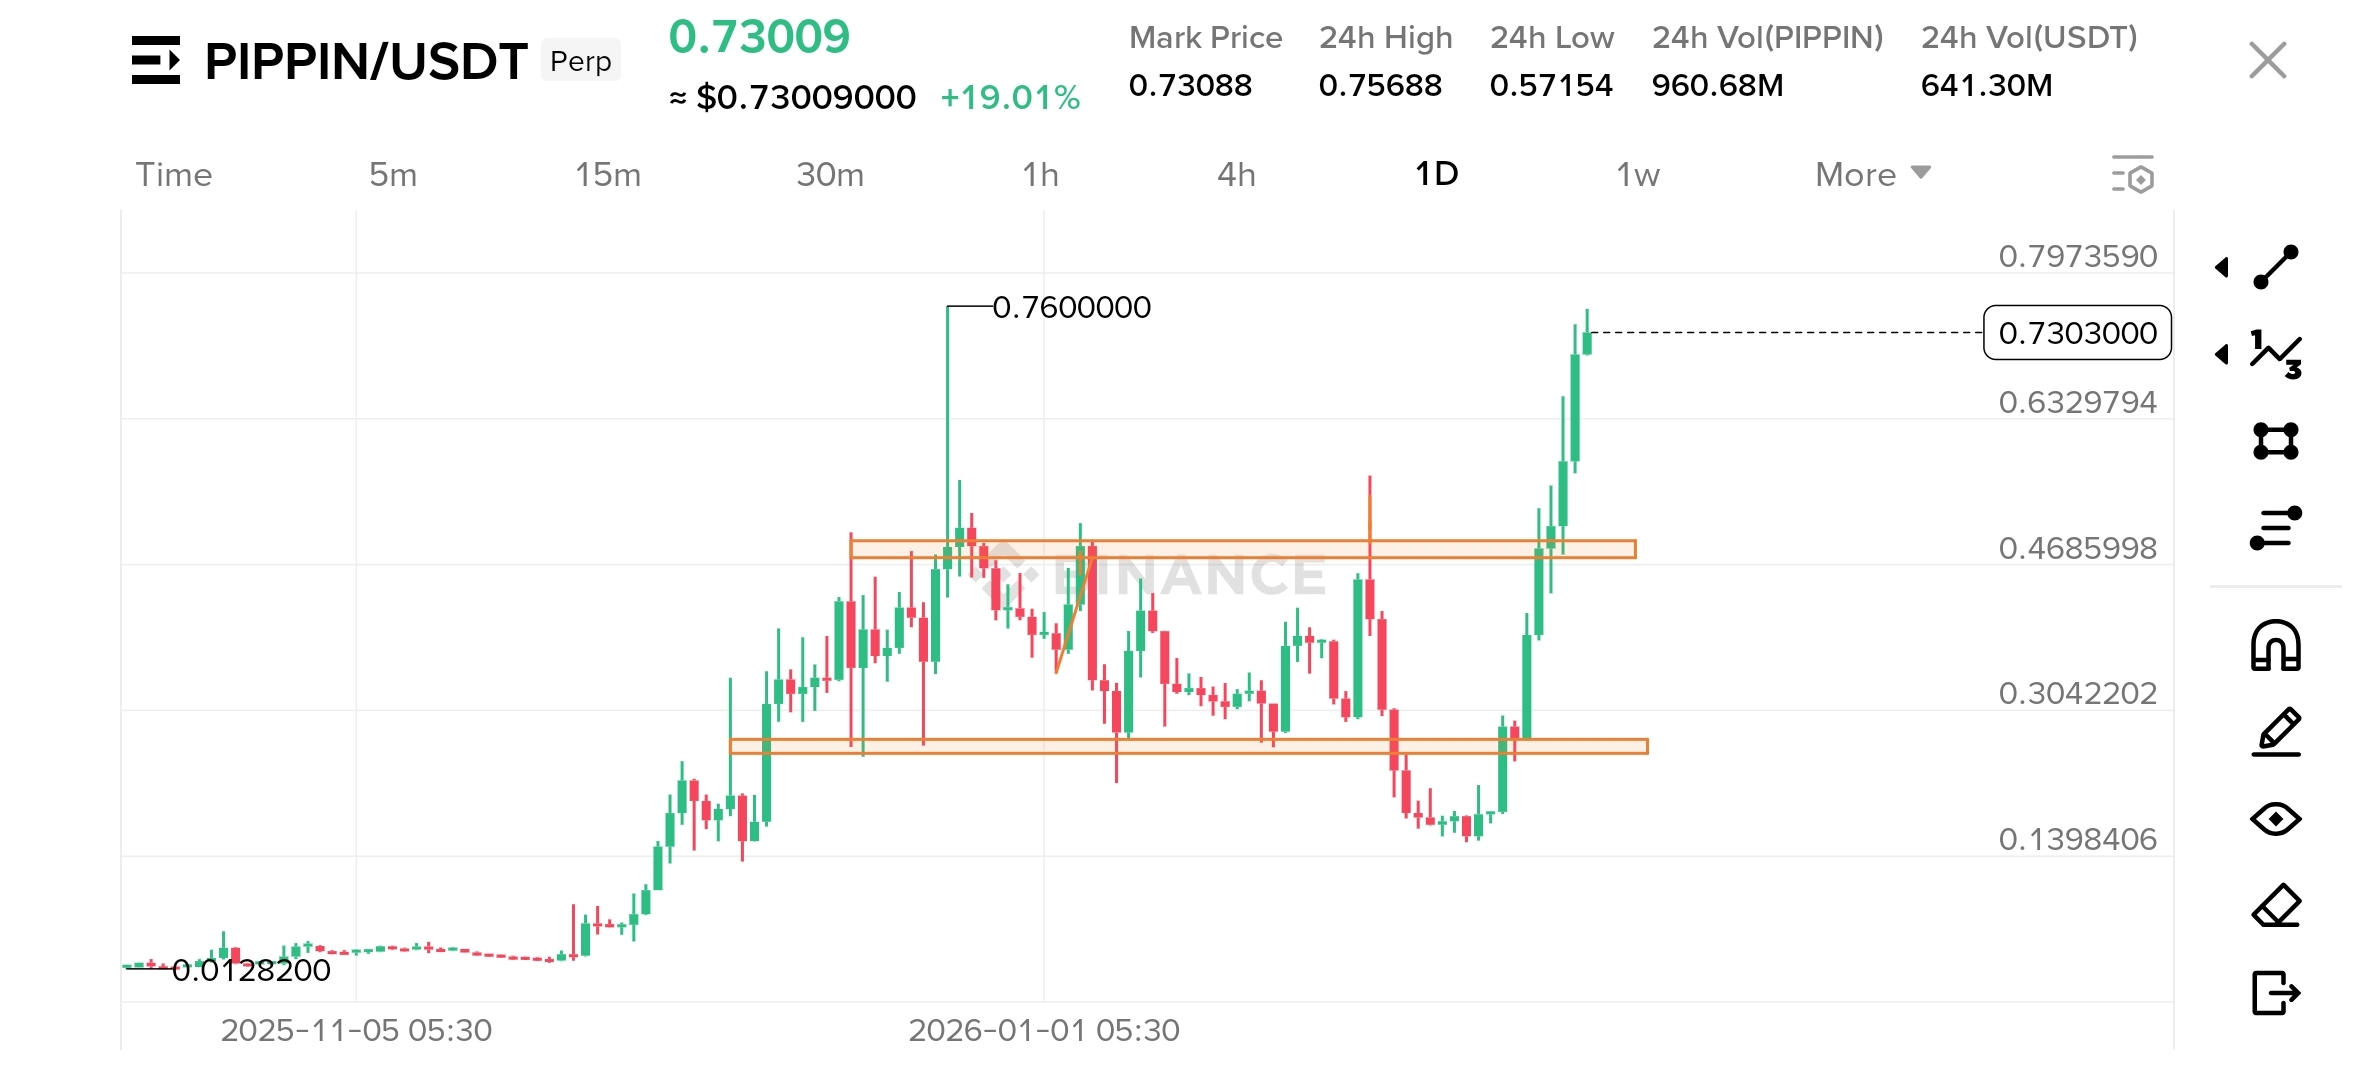
PIPPIN didn’t just pump randomly.
It built liquidity first.
Price ranged for weeks between the marked zones. That range did two things:
Collected late longs buying every green candle
Built short interest at the range highs
Once enough orders stacked on both sides, price expanded fast.
That vertical push to 0.76 was not “strength”.
That was liquidity delivery.
2. How the Trap Works:
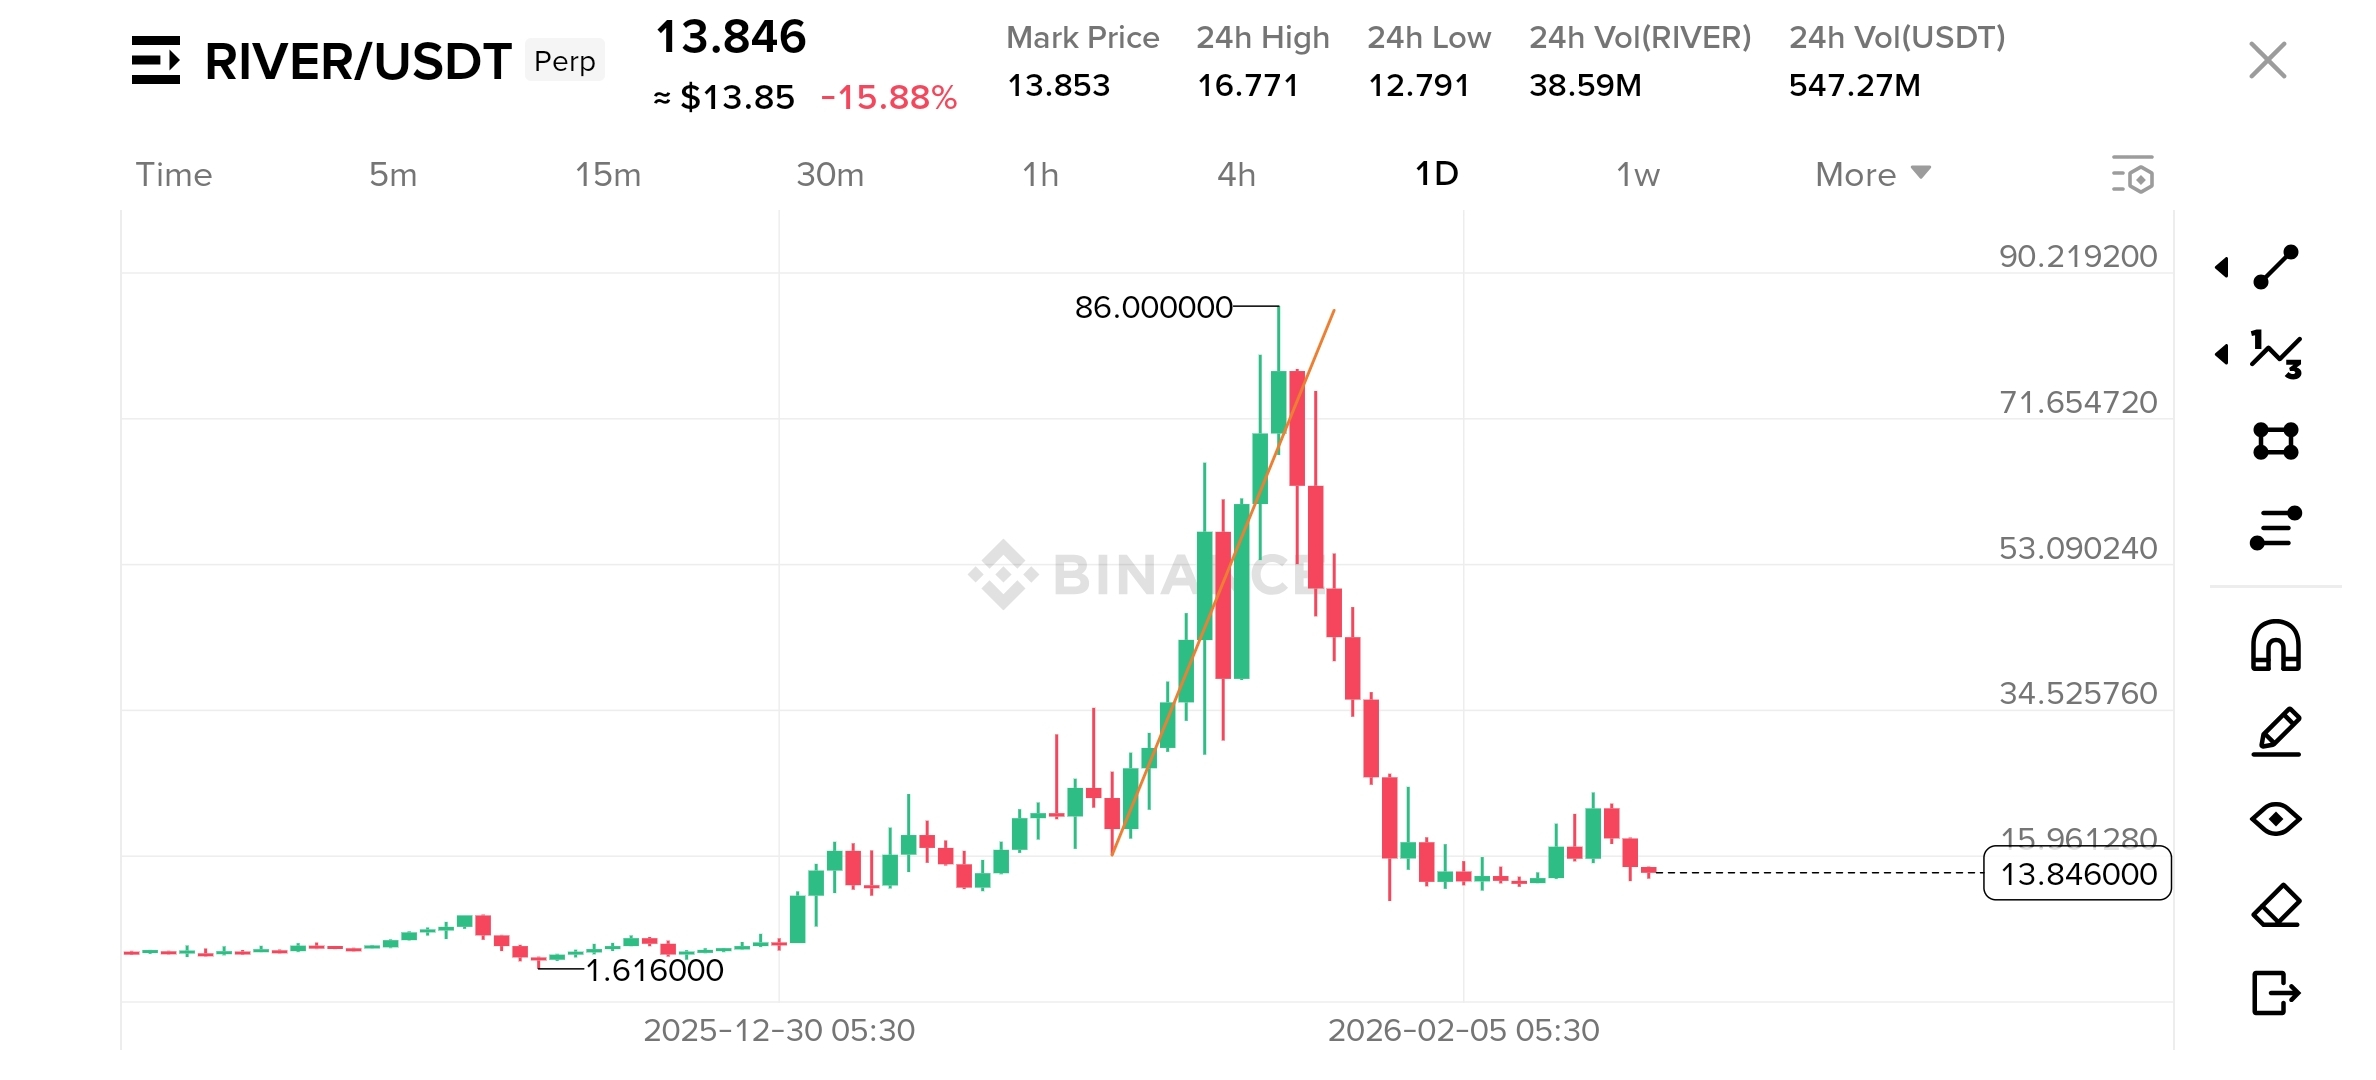
Look at RIVER:
Slow grind up
Steeper candles
Trendline worship
Social hype
Then one sharp peak
That final leg is where:
Late longs enter without stops
Shorts get squeezed
Funding flips aggressively
After that, the market does what it always does:
It removes one side completely.
RIVER wiped longs brutally from 86 → sub 15.
3. PIPPIN Did the Same Thing (Cleaner Execution)
On PIPPIN:
First expansion to 0.76 cleaned shorts
Sharp pullback shook weak longs
Range formed again (false sense of safety)
Then impulsive reclaim and vertical continuation
That last green leg? That’s short liquidation + breakout FOMO combined.
Not sustainable on its own.
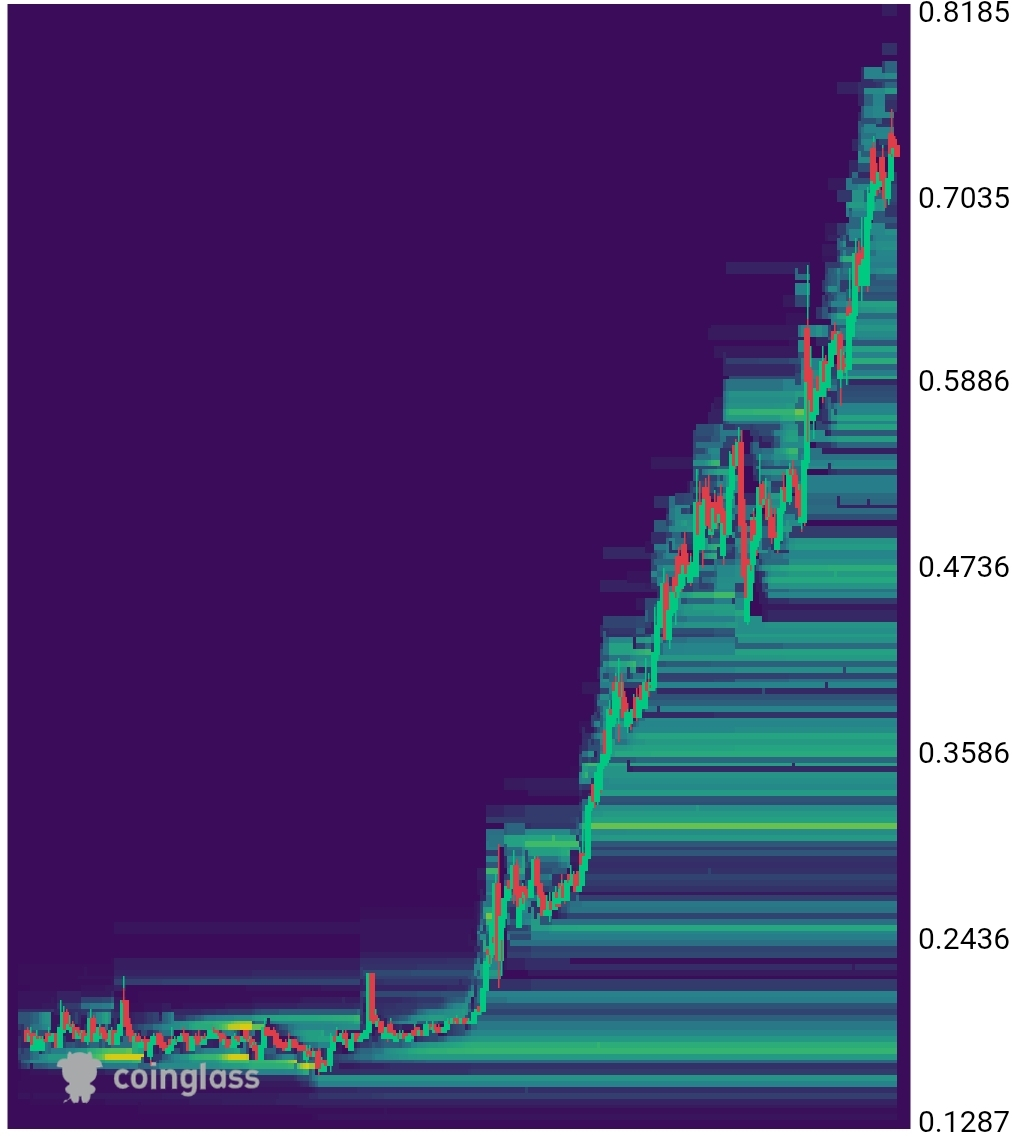
4.Liquidity: What This Chart Is Actually Showing
This Coinglass heatmap explains the entire move better than candles ever will.
Those bright horizontal bands aren’t support or resistance in the retail sense.
They’re clusters of resting orders, stop losses, and liquidations.
At the bottom, you can see a long period of low activity. That’s where:
Interest was dead
Positions were light
Liquidity was thin
Nothing happens there because there’s nothing to take.
Then notice what happens as price starts moving up.
Every step higher:
New liquidity forms below
Old liquidity gets consumed
Price moves from one liquidity pocket to the next
This is why the move looks stair-stepped instead of smooth.
Why Price Keeps Grinding Up
Price doesn’t jump randomly.
It moves toward the largest pool of orders.
On this chart:
Liquidity keeps building below price
Shorts keep stacking stops above
Late longs keep placing stops just under structure
That creates a one-way magnet.
As long as:
Liquidity below is thicker than above
Funding encourages one side to lean too hard
Price continues in the same direction.
Not because it’s “bullish”.
Because there’s unfinished business below.
Where Traders Get Wiped
The danger zone is near the top of the heatmap.
When you see:
Thin liquidity above
Heavy liquidity below
Vertical candles
That’s when:
Late longs are fully committed
Stops are obvious
A single push down can trigger a cascade
This is exactly how RIVER topped.
Price went up until there was nothing left to take, then snapped back to where liquidity was thickest.
How to Took at this after seeing all these coins
Stop asking: “Is this bullish or bearish?”
Start asking:
Where is liquidity stacked?
Which side is overexposed?
What happens if price moves just a little against the crowd?
Candles tell you the story after it happens.
Liquidity tells you where price is likely to go next.
5. What Usually Comes Next
Markets don’t move to reward traders.
They move to rebalance exposure.
After moves like this, one of two things happens:
High-timeframe consolidation while funding resets
Sharp retrace to retest the last real demand zone
What almost never happens:
Straight up continuation without pause
Clean trends retail expects
If price holds above reclaimed zones with volume and absorption, continuation is possible.
If it stalls and volume fades, expect a liquidity sweep below.
6. The Real Lesson (Most Traders Miss This)
Both RIVER and PIPPIN show the same truth:
Big candles are effects, not causes
The move already happened before you noticed
Liquidity is taken first, narrative comes later
Chasing green candles is how traders become liquidity.
If you’ve traded RIVER, PIPPIN’s structure shouldn’t surprise you at all.
Same playbook. Different ticker.
I am sure many of you caught RIVER late and promised yourself you wouldn’t do it again? So what now ?