@BNB Chain 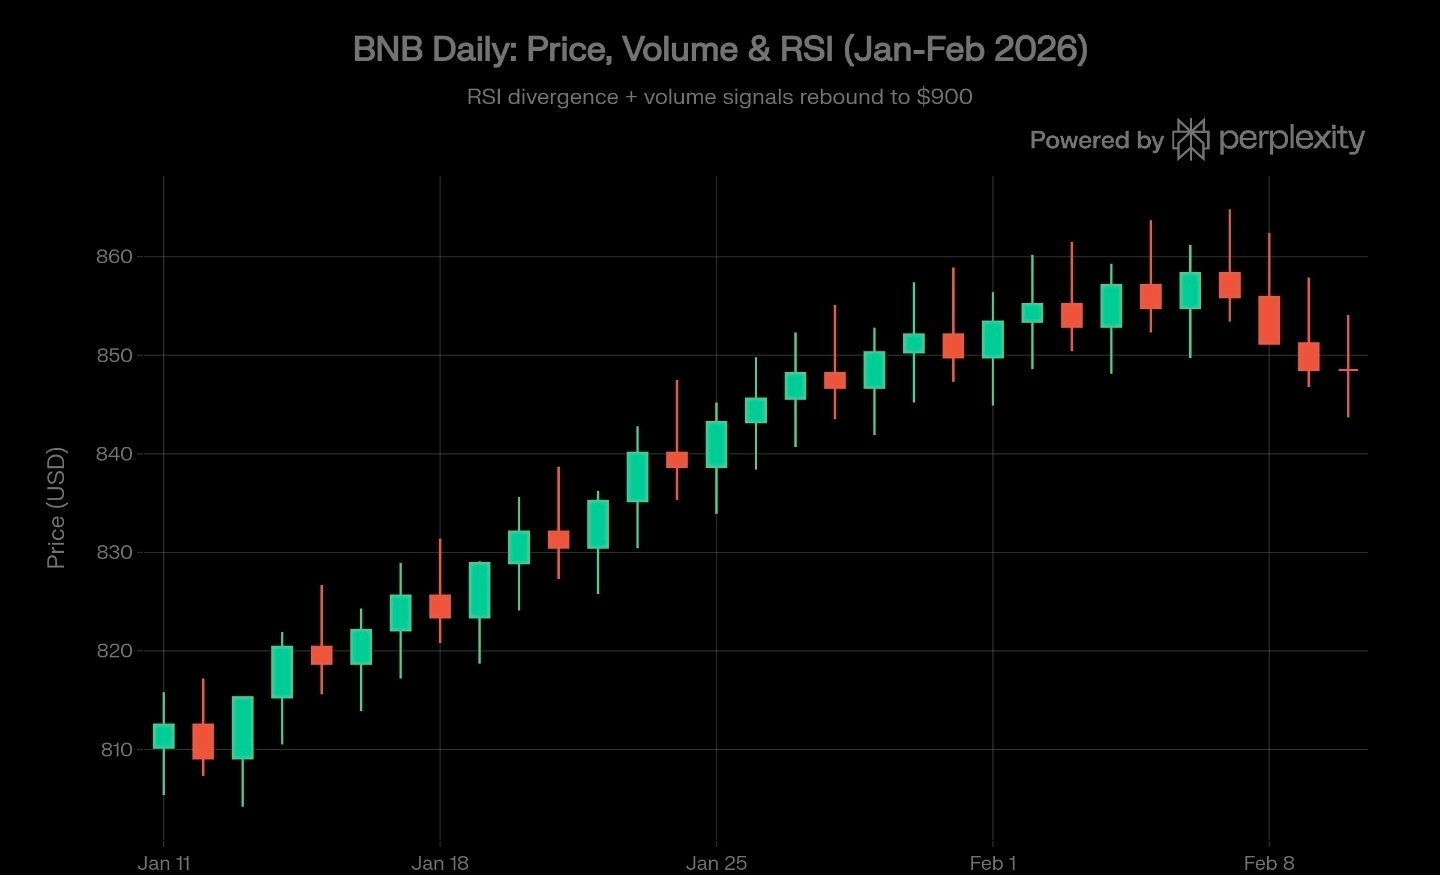 king at the daily chart from January through February 2026, the price action for BNB shows a classic ascending trend with a series of higher highs and higher lows. Starting from the $810 level in mid-January, the asset staged a disciplined climb, peaking near $860. However, the most critical signal for traders right now is the RSI divergence visible on the daily timeframe. While the price reached local peaks in early February, the momentum began to flatten, a signal that often precedes a consolidation phase before the next major leg up.
VOLUME SIGNALS AND THE PATH TO $900
The profile accompanying this move suggests strong institutional interest during the dips. Every red candle in late January was met with significant buying volume, keeping the trend intact. With the RSI now resetting, the technical setup points toward a potential rebound targeting the $900 psychological barrier. For the Binance ecosystem, BNB remains the core utility asset, and its strength during this period of market volatility highlights its role as a primary liquidity hub. Traders should keep a close eye on the $840 support level to confirm the continuation of this bullish structure.
This content is purely for educational purposes and not for promotion.
Warm regards