This is a Bitcoin (BTC/USD) price chart with technical analysis indicators and support/resistance zones. Here's a breakdown of what the chart shows:
---
📊 Chart Type
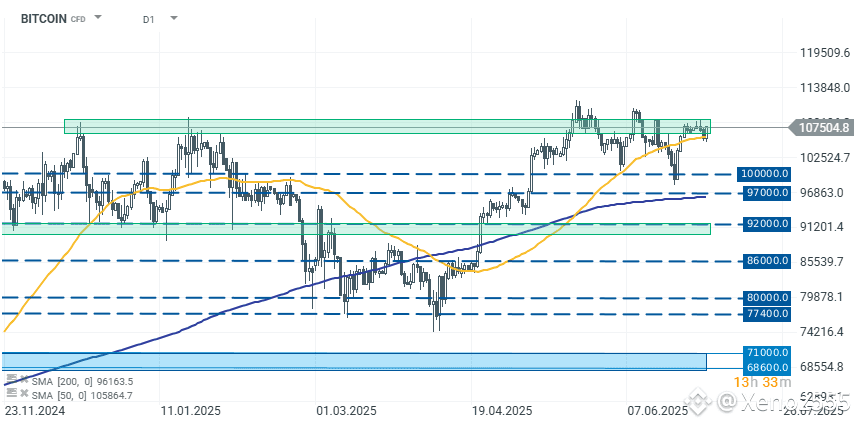
Instrument: Bitcoin CFD (Contract for Difference)
Timeframe: Daily (D1) – Each candle = 1 day
---
📈 Price Trend Overview
Current BTC price (approx.): $107,504.8
General trend: Uptrend (price has been rising since mid-March 2025)
---
🔧 Technical Indicators
SMA (200-day) – Blue line: Support level around $96,163.5
SMA (50-day) – Yellow line: Support level around $105,864.7
---
🟩 Resistance Zones (Green Boxes)
$107,000 – $113,000: Price is testing this resistance area now
Rejected multiple times in this zone previously
A breakout above could signal a move toward $113,848 or higher
---
🟦 Support Levels (Dashed Blue Lines)
These are potential downside support zones:
$100,000 – Psychological support
$97,000
$92,000 – Also a historical accumulation zone
$86,000
$80,000
$77,400 – Previous bottom
$71,000
$68,600 – Strong lower support zone
$62,893 – Chart bottom (as of 26 July 2025)
---
🔵 Highlighted Support Zones (Blue Boxes)
Major support area: Between $68,600 – $71,000
Price bounced from this area in early 2025
---
📅 Key Dates
From 23 November 2024 to 26 July 2025
Notable rally began in mid-March 2025
Pullback and consolidation seen between April–June 2025
Retesting resistance in early July 2025
---
📌 Summary
Bullish momentum is building, with price above both the 50-day and 200-day SMAs.
BTC is currently testing a strong resistance zone (~$107,000–$113,000).
Key support lies between $97,000 and $92,000, and stron
ger support is at $68,600–$71,000.
Break above $113,000 could lead to next targets near $119,509.
#bitcoin #CryptoAnalysis" $BTC #BitcoinDunyamiz #BitcoinNews #BitcoinPrediction