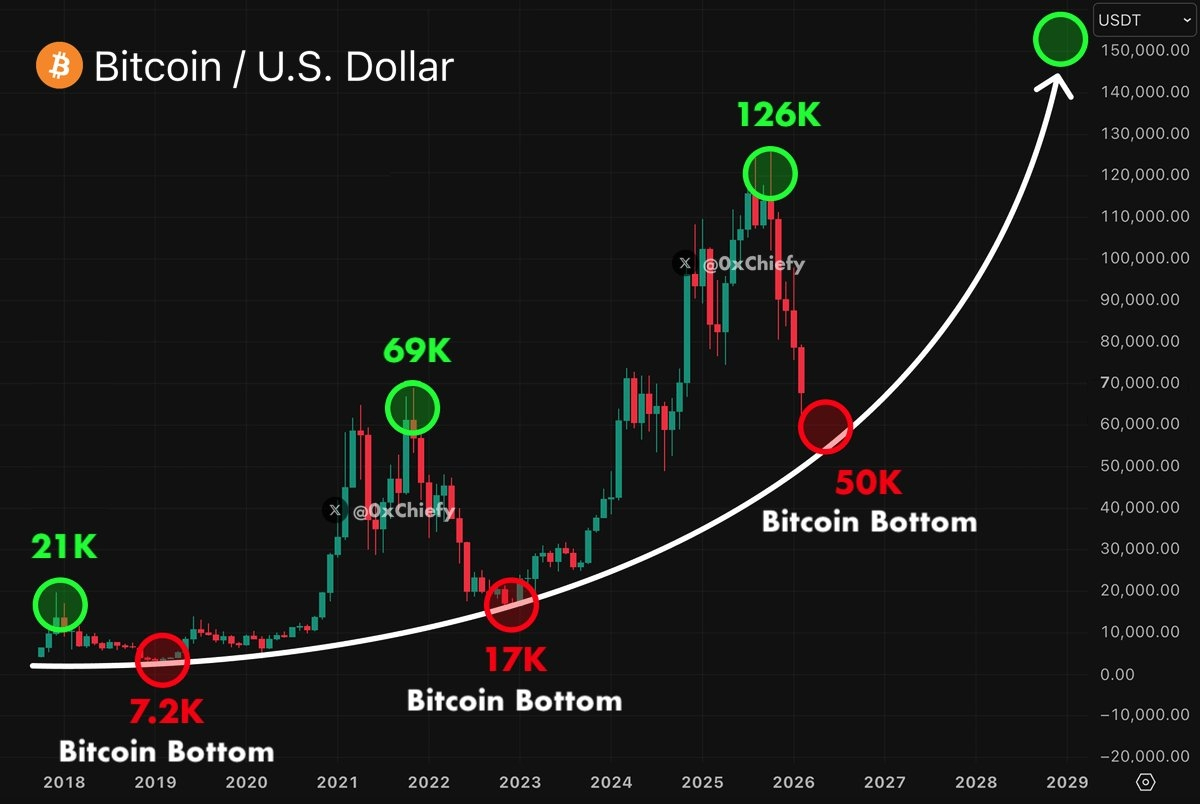
This chart has a strong track record of identifying major Bitcoin bottoms. Looking at previous cycles, the pattern has remained surprisingly consistent.
Here’s the typical structure we’ve seen:
🔹 Blow-off top
🔹 Sharp correction
🔹 Final capitulation toward the curve
🔹 And then… liftoff 🚀
The same setup appeared around $7.2K and $17K, and now the model suggests we could see one more flush toward the $50,000 zone.
⏳ Estimated timing: around the next 12 days.
Important to understand — this isn’t necessarily bearish. Historically, these shakeouts often create the last major opportunity before a new expansion phase begins.
Weak hands tend to panic.
Smart money tends to prepare.
Ignore the signal if you want — just don’t say you weren’t warned.