Bitcoin is currently trading in a tight consolidation range, with strong support near $65,000 and major resistance around $70,000–$78,000. This range has created a tense battle between bulls and bears as traders wait for the next decisive move.
The big question in the crypto market right now is simple:
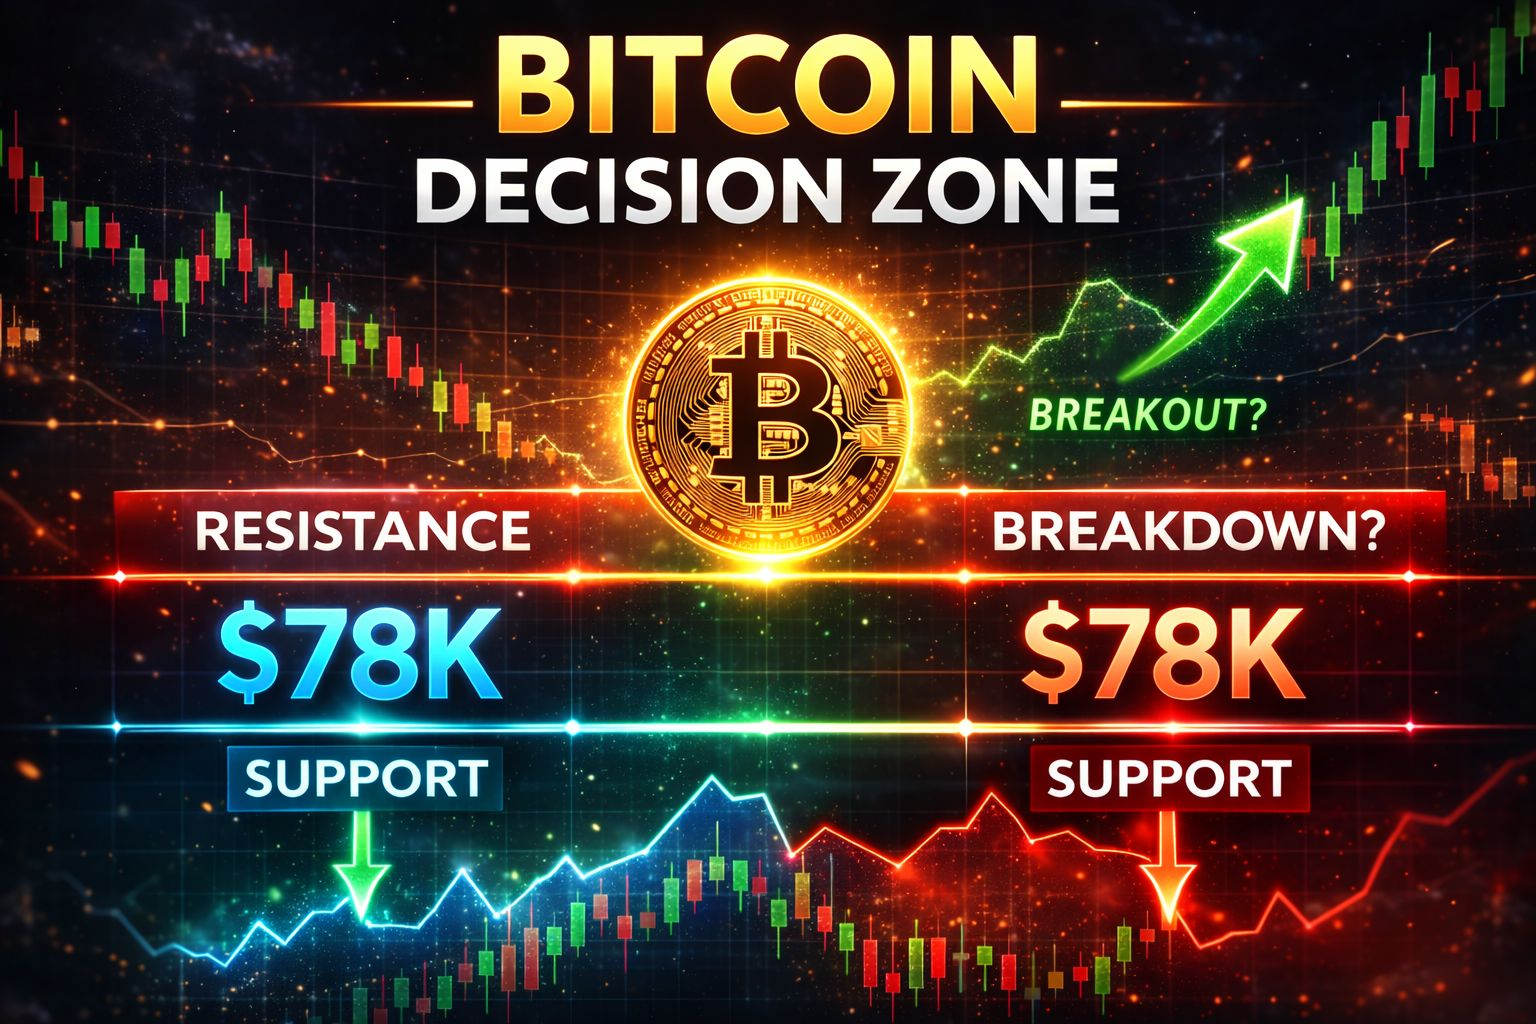
Will Bitcoin break below support or explode above resistance first?
Let’s analyze the key levels and scenarios shaping the market.
🔑 Key Levels to Watch
🟢 Support Zone — $65,000
The $65K level is currently one of the most important psychological support levels for Bitcoin. If the price holds above this zone, it signals strong buying pressure from investors.
Many analysts consider $65K the level where buyers are likely to step in aggressively.
However, if Bitcoin closes below this level, it could trigger a deeper correction toward $60K or even $58K, where the next major support zones exist.
This is why traders closely monitor this level during market pullbacks.
🔴 Resistance Zone — $70K to $78K
On the upside, Bitcoin faces strong resistance between $70K and $78K, where previous rallies have repeatedly stalled.
Technical analysis shows that Bitcoin must close above approximately $68.5K–$69K with strong volume to confirm a bullish breakout.
If this resistance breaks, the next potential targets could be:
$72K
$75K
$78K–$80K
A confirmed breakout could trigger a new wave of momentum in the crypto market.
⚖️ Why Bitcoin Is Moving Sideways
The current price action reflects market consolidation, a common phase before a large move.
During consolidation:
Buyers accumulate positions near support
Sellers defend resistance levels
Market volatility decreases temporarily
Indicators such as RSI also show neutral conditions, suggesting that Bitcoin is neither overbought nor oversold right now.
This balance often precedes a major breakout in either direction.
📉 Bearish Scenario
If Bitcoin fails to hold the $65K support, the market could see a sharper correction.
Possible downside targets:
$62K
$60K
$58K liquidity zone
A breakdown usually occurs when selling pressure increases due to macroeconomic factors, ETF outflows, or leveraged liquidations.
📈 Bullish Scenario
If Bitcoin breaks above the resistance range, the market structure would shift bullish.
Possible upside targets:
$72K
$75K
$80K
A breakout often happens when volume increases and institutional buying returns to the market.
Some analysts believe strong risk appetite and ETF inflows could eventually push Bitcoin toward $110K–$120K in a bullish macro scenario.
🔮 Final Thoughts
Bitcoin is currently at a critical decision point.
The $65K support and $70K–$78K resistance range represent a classic market compression phase.
👉 Break below $65K → possible correction
👉 Break above $70K–$78K → potential bullish continuation
Until one of these levels breaks, the market will likely remain range-bound with short-term volatility.
For traders and investors, the key is patience — because when Bitcoin finally escapes this range, the next move could be fast and powerful.
#Bitcoin
#CryptoMarket
#BTCAnalysis
#CryptoTrading
#Blockchain