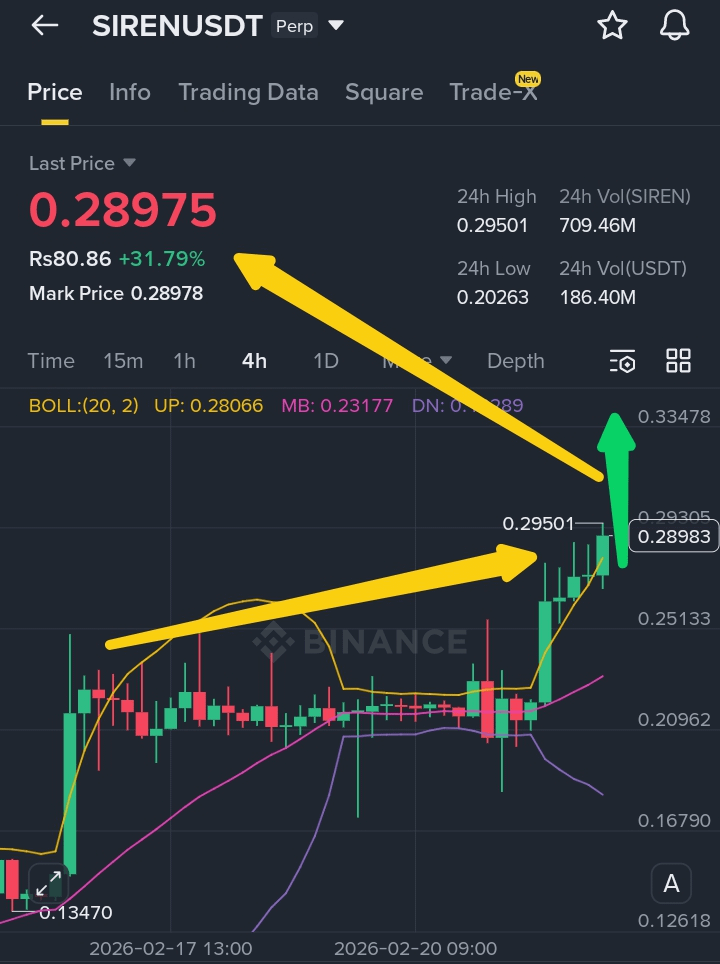
$SIREN has surged over +30% within a short period, breaking above the 0.28–0.29 resistance zone with strong volume expansion. On the 4H timeframe, price previously moved sideways in a tight consolidation range between 0.20–0.23. This compression phase allowed volatility to contract while buyers gradually accumulated positions. Once price reclaimed the mid Bollinger Band and closed above short-term resistance, momentum accelerated sharply.
The breakout above 0.25 triggered a wave of short covering and momentum inflow. Open interest expansion combined with strong 24H volume confirms participation, not just a low-liquidity spike. The move toward 0.295 represents volatility expansion after compression — a classic technical breakout structure.
📈 Why Did $SIREN Pump?
• Tight consolidation and volatility compression
• Break above 0.25 resistance
• Strong 4H structure shift (higher highs & higher lows)
• Short liquidations
• High relative volume inflow
📊 Current Structure
Short-Term Trend: Bullish
Momentum: Strong expansion phase
Volatility: Breakout mode
📍 Key Levels to Watch
Support: 0.25–0.26
Breakout Zone: 0.28–0.29
Next Resistance: 0.33–0.35
If price holds above 0.25 and builds higher lows, continuation toward 0.33+ becomes technically possible. However, parabolic moves often experience pullbacks to retest breakout zones before continuation. Failure to hold 0.25 could lead to a quick retracement toward 0.23.
Momentum is strong, but expansion phases require disciplined risk management. Confirmation above resistance is more sustainable than chasing extended candles.
Don't Miss $SIREN
If this breakdown helped you understand the real reason behind $SIREN’s pump, LIKE 👍 and FOLLOW 🔔 for more structured crypto analysis.
#siren #CryptoAnalysis #Breakout #altcoins #BinanceSquare