1️⃣ Trend Direction
The overall structure is bearish.
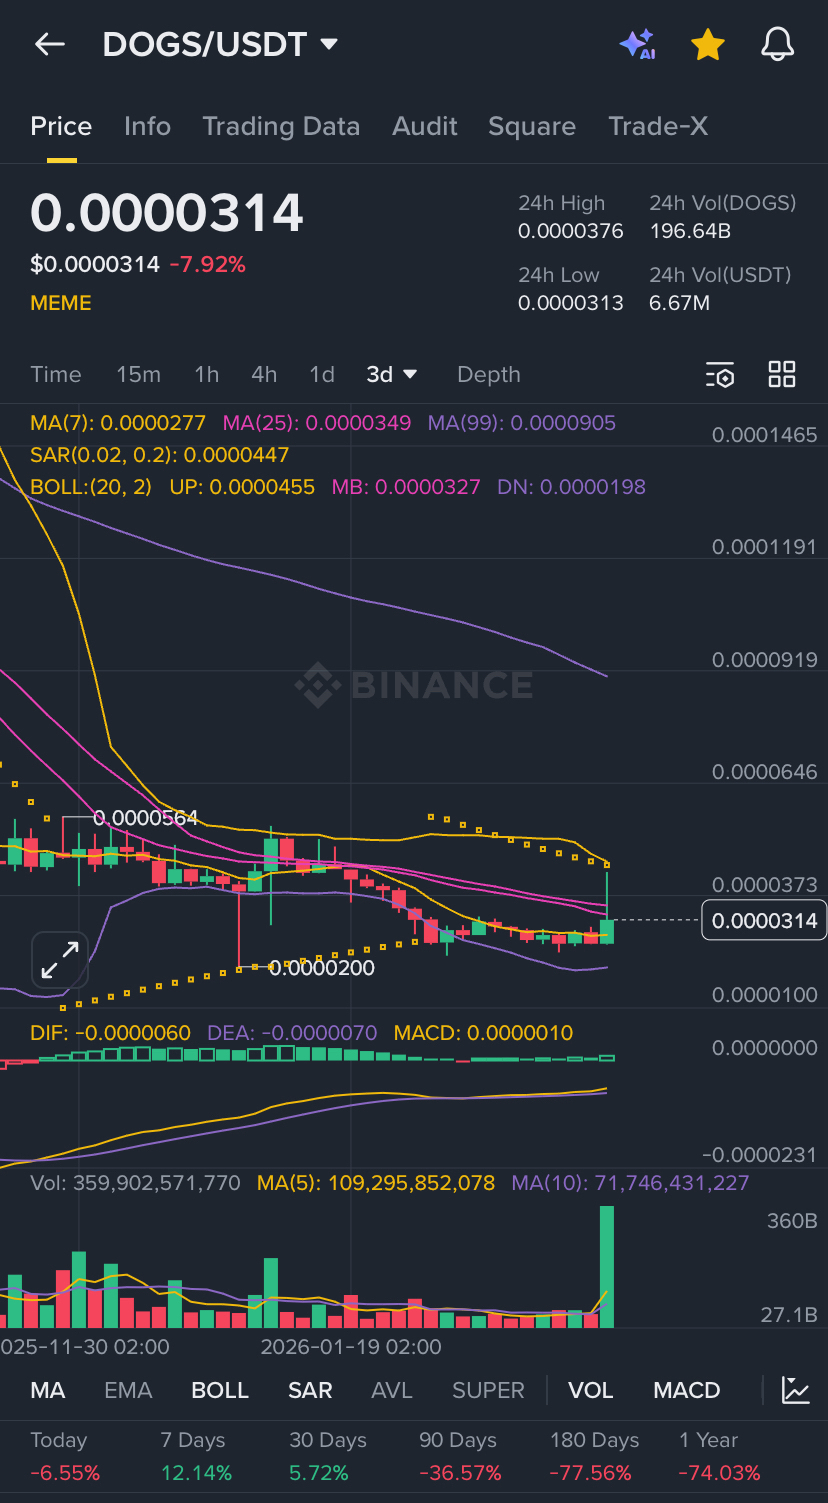
Price is trading below MA(25) and far below MA(99).
Long-term trend is still downtrend.
This means the market still has heavy selling pressure.
2️⃣ Current Support Zone
Important support areas visible on the chart:
0.0000200 → Major historical support
0.0000300 – 0.0000310 → Current holding area
Price is currently 0.0000314, slightly above this support.
If this level holds, a short-term bounce is possible.
3️⃣ Resistance Levels
If price moves up, watch these levels:
0.0000345 – 0.0000350 → MA25 resistance
0.0000370 – 0.0000400 → Strong resistance zone
Price must break these to confirm bullish momentum.
4️⃣ Indicators
MACD
Slight bullish momentum starting.
Histogram turning green → possible short-term recovery.
Volume
Large green volume candle appeared.
This suggests buyers are entering.
Bollinger Bands
Price bouncing from lower band, often signals temporary reversal.
5️⃣ Possible Scenarios
📈 Bullish Scenario
If price holds 0.0000300 support:
Targets:
0.0000345
0.0000370
0.0000400
This would be a relief rally.
📉 Bearish Scenario
If 0.0000300 breaks:
Next levels:
0.0000250
0.0000200
That would continue the downtrend.
6️⃣ My Trading View (Short Summary)
Short term: Small bounce likely
Mid term: Still bearish until 0.000040 breaks
Key level to watch: 0.000030