
In financial markets, especially in the crypto market, traders often combine various technical indicators to achieve the best profits. However, to understand how to effectively use technical indicators, we must know their meanings and applications to achieve the best results.
Trend Indicator Group
Moving Average - MA line
Moving Average (MA) is a popular technical analysis indicator, especially used by crypto traders when scalping. This indicator helps identify trends over a specific time period and is often effective in M15, H1, and H4 frames.
By taking an average price based on predefined settings, MA smooths short-term volatility, thereby clarifying the main trend of the market and assisting traders in making more accurate trading decisions.
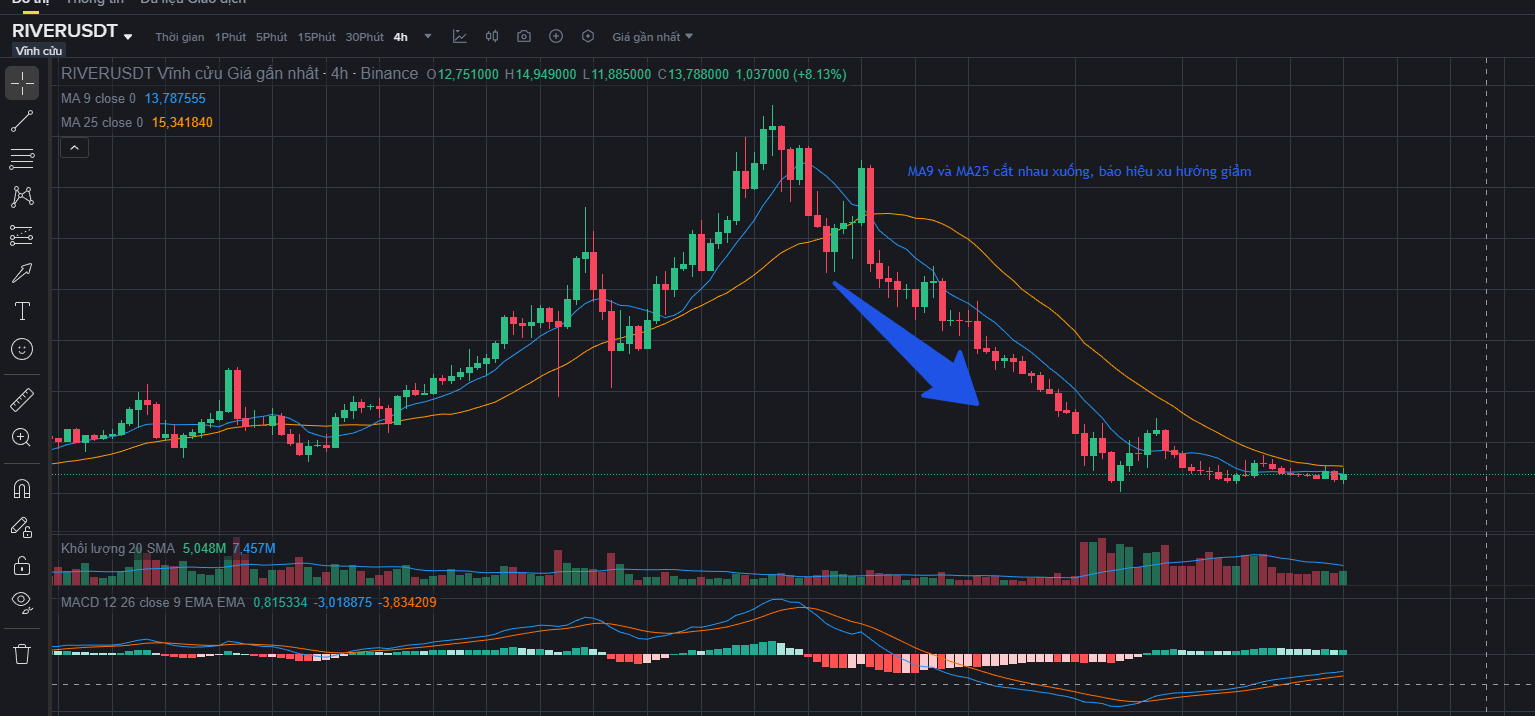
From the chart above, we can clearly see MA9 crossing below MA25 signaling a downtrend of RIVER in the H4 frame.
With its simplicity and ease of use, the Moving Average has become an important tool that helps optimize short-term trading results for traders.
Bollinger Band
Bollinger Bands, also known as Bollinger Band, is a popular technical analysis indicator used to measure volatility and identify price trends.
To use Bollinger Bands when identifying trends, traders often consider the interaction between price and Bollinger Bands on the price chart. Bollinger Bands consist of three main components:
Middle Band: This is a moving average that is usually a simple moving average (SMA) of the closing price over a specific period. This moving average represents the main trend of the price.
Bollinger Upper Band: This is a line that moves more than 2 units from the standard deviation of the moving average. The upper line represents a potential resistance level in an uptrend.
Bollinger Lower Band: This is also a line that moves less than 2 units from the standard deviation of the moving average. The lower line represents a potential support level in a downtrend.
When the price rises and stays above the moving average and upper line, this indicates a strong uptrend. Conversely, when the price falls and remains below the moving average and lower line, this indicates a strong downtrend.
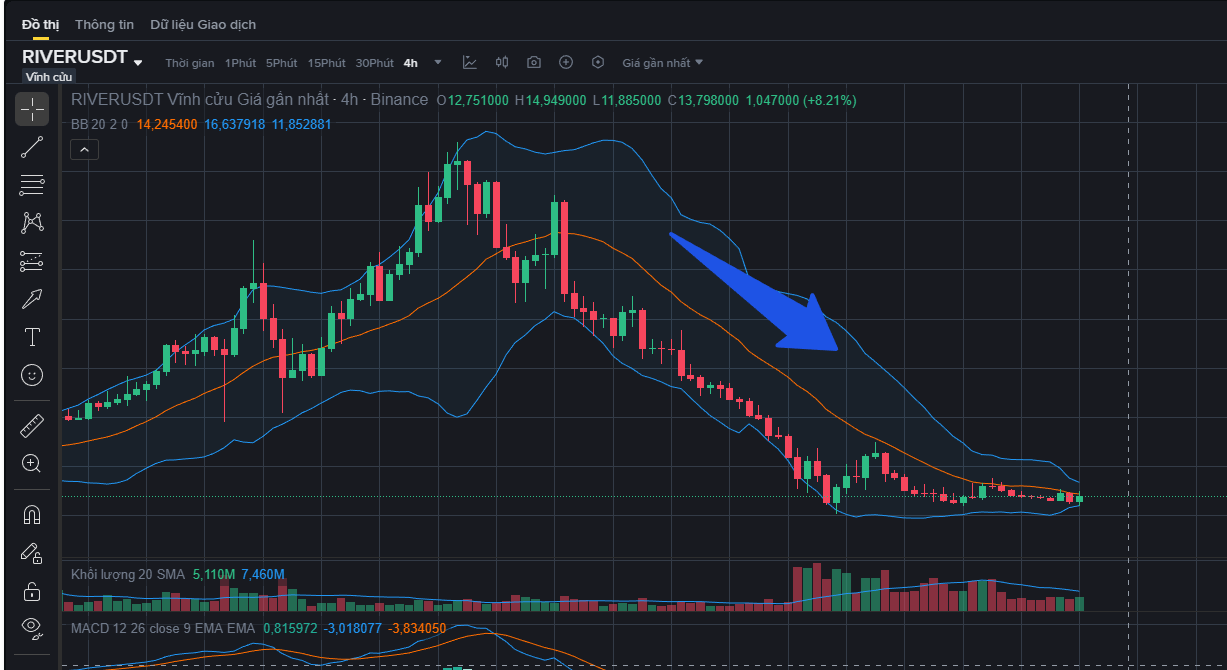
From the chart above, we can see that the price is trading below the Lower Band and continues to decline thereafter.
Momentum Indicator Group
RSI.
RSI (Relative Strength Index) is a popular technical indicator in crypto, used to measure price strength and identify overbought or oversold states of an asset. RSI ranges from 0–100, helping traders determine reasonable entry points.
Usually, an RSI above 70 indicates that the asset is overbought and poses a risk of correction, while an RSI below 30 reflects an oversold state and may present buying opportunities.
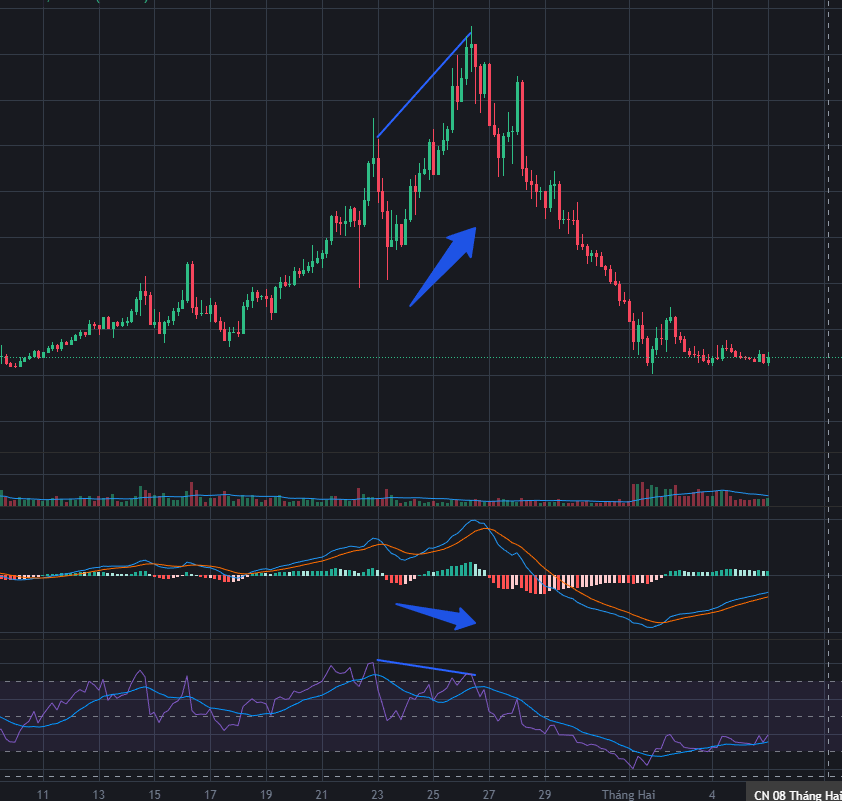
From the chart above, we can clearly see when the market is in an overbought trend, it creates buying pressure that causes the price to rise sharply, but when it reaches above 70, the buying pressure will gradually weaken indicating profit-taking by investors, and on the RSI chart, it has diverged with two peaks against the price line, signaling a trend reversal.
Moving Average Convergence Divergence (MACD)
MACD (Moving Average Convergence Divergence) is a technical indicator used to measure momentum and trend strength in the market, based on the difference between two moving average lines, typically EMA12 and EMA26.
MACD is calculated by taking EMA12 minus EMA26. When MACD is positive, it indicates that the price is rising rapidly in the short term; when MACD is negative, the downtrend is dominant. A buy signal appears when the short-term EMA crosses above the long-term EMA, and a sell signal appears when it crosses below, reflecting a reversal or acceleration of the price trend.
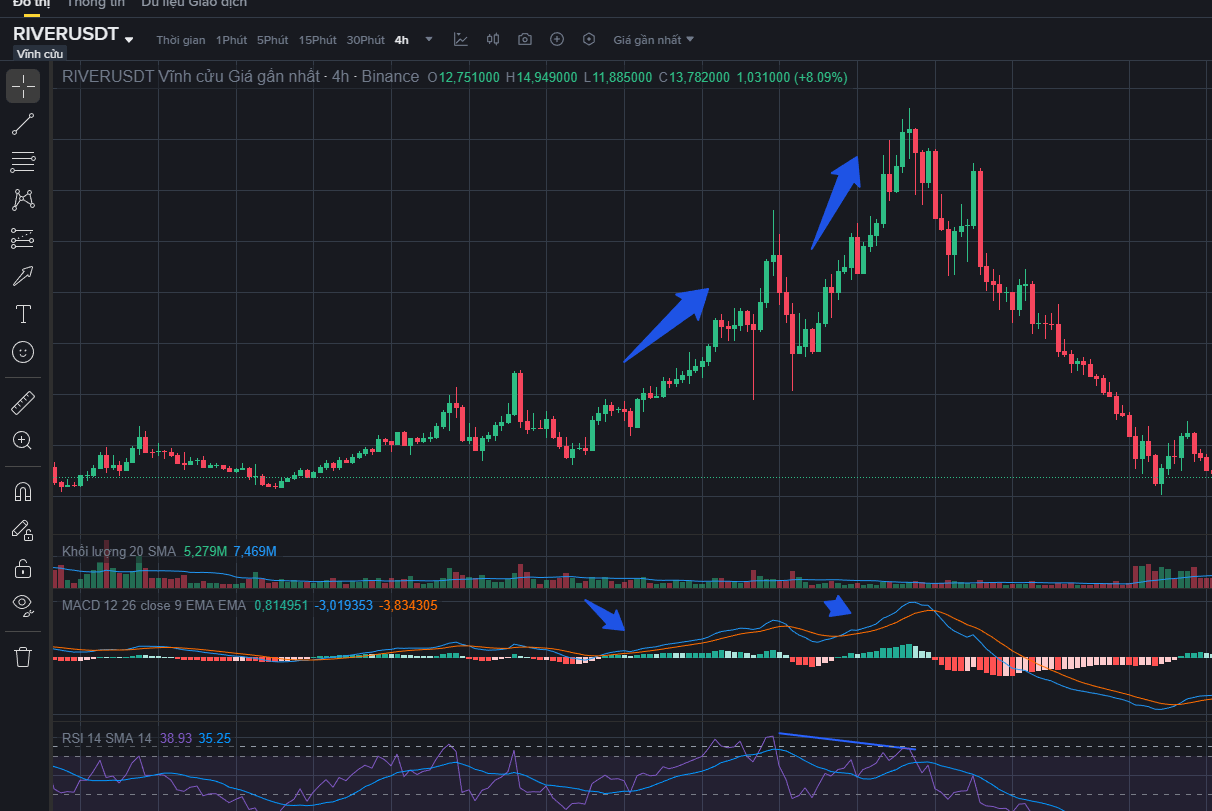
From the chart above, we can clearly see that when the EMA12 line crosses below EMA26, the price shows signs of decline, and the MACD index will have more red than green and vice versa.
Support and Resistance Indicator Group
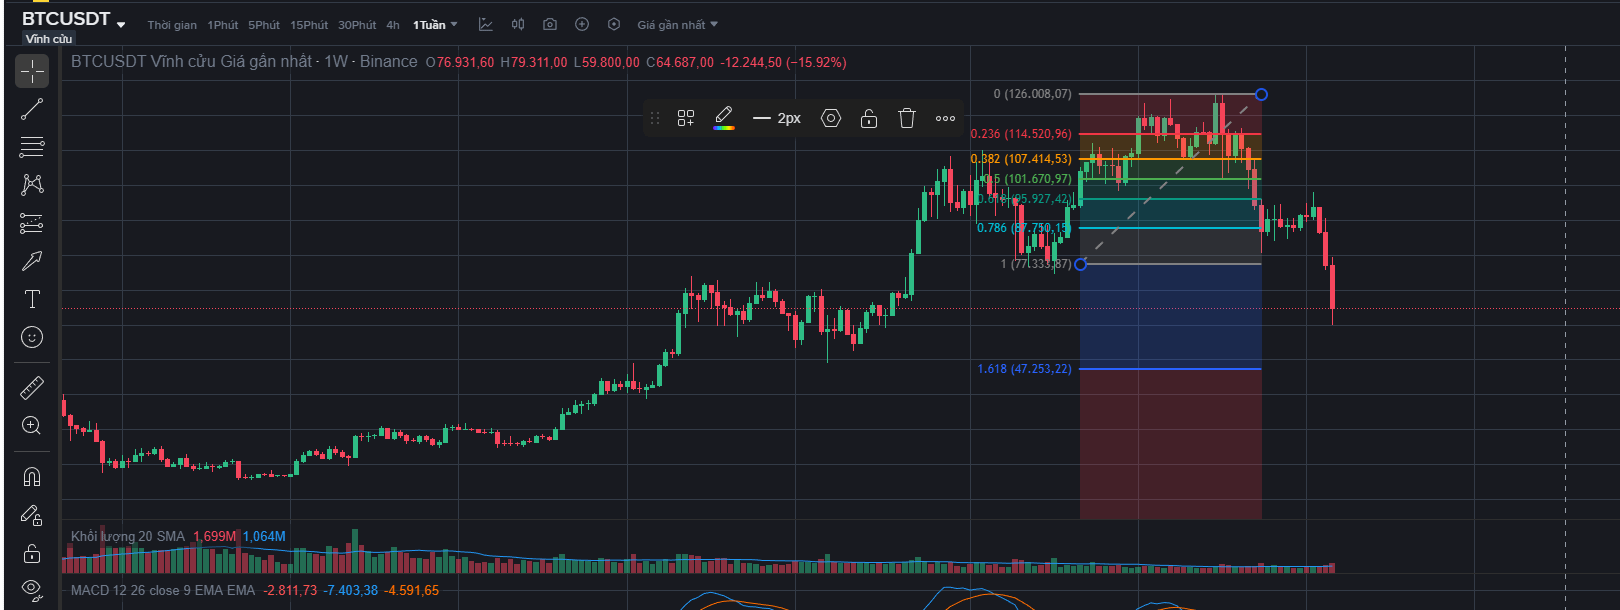
Fibonacci Retracement is a tool used to identify potential support and resistance areas when the price corrects in a main trend. After each rise or fall, the market often has pullback phases before continuing the trend.
Common Fibonacci levels such as 0.382, 0.5, and 0.618 help traders identify price areas where buying or selling pressure may appear, thereby finding entry points and managing risk more effectively.
Typically, Fibonacci can be effectively applied to all time frames; however, it works best on larger time frames such as H12, D, W, M.
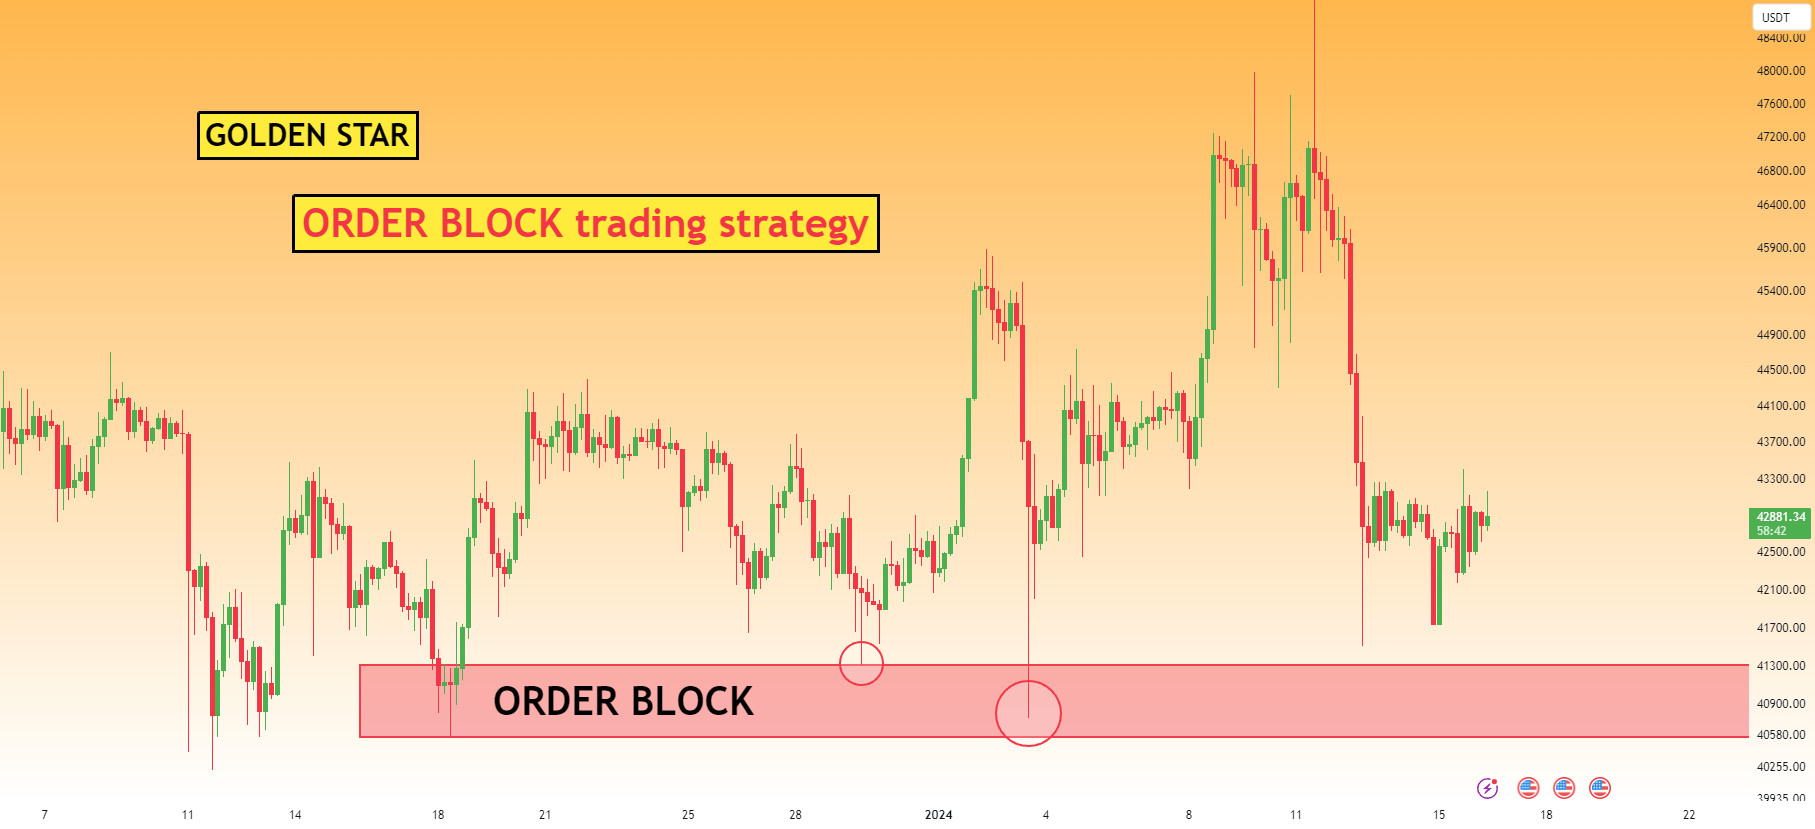
Order block
An Order block is an area on the price chart that concentrates the buy or sell orders of traders. This is a popular analytical technique in traditional financial markets and is now widely applied in the crypto market.
When the price touches the upper Order Block, selling pressure often increases and may create resistance. Conversely, the lower Order Block typically attracts strong buying pressure, acting as support. Traders often identify Order Blocks in sideways price areas before a strong up/down movement, combined with high volume and key levels to find reasonable entry points.
The way to identify an Order Block is as follows:
Identify price concentration: Find areas on the chart with narrow trading ranges or candlesticks, indicating competition in buying and selling.
Identify strong areas: Order Blocks often occur in areas with significant price spikes or drops, indicating strong participation from traders.
Identify important price levels: Order Blocks often appear at support, resistance, pivot points, Fibonacci retracement, or other significant price levels.
Consider trading volume: Order Blocks with higher than normal trading volume indicate strong participation from traders.
Identify entry and exit points: Use Order Blocks as entry and exit points. For example, when the price approaches an Order Block above a resistance level, it could be a selling point. Conversely, when the price approaches an Order Block below a support level, it could be a buying point.
Trader Participation Indicator Group - Volume Indicator
Volume - Trading Volume
Volume is an important technical indicator in financial markets, measuring the number of shares, assets, or contracts traded over a specific period. This indicator reflects the interest and participation of traders in the market.
Volume provides an important perspective on market strength. The consensus between price and volume often confirms the trend forming, while conflict between these two factors may warn that the current trend is weakening.
Additionally, Volume helps identify entry and exit points: strong volume increases alongside price increases indicate active buying pressure, while decreasing or weakening volume when prices drop may signal reconsideration of selling or taking profits.
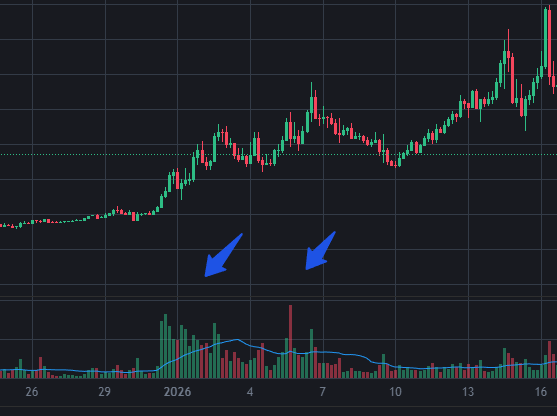
From the chart, we can clearly see that the trading activity of this coin has a rising trend during this time, and the price is similar.
However, it should be noted: Trading volume only reflects the number of participants buying/selling, not the specific buying or selling pressure.
Volume Profile
Volume Profile is a technical analysis tool used in financial markets to display the cumulative trading volume at each price level over a specific period, usually on specific time segment charts such as H1, H4, or D1.
Volume Profile shows which price levels are most traded, thereby reflecting where the market is truly interested. Areas with large volumes often serve as important support or resistance levels and are targets for traders.
This indicator displays as bars (rectangles) along the price axis, where the width represents the trading volume at each price range, helping to quickly identify high-meaning price areas.
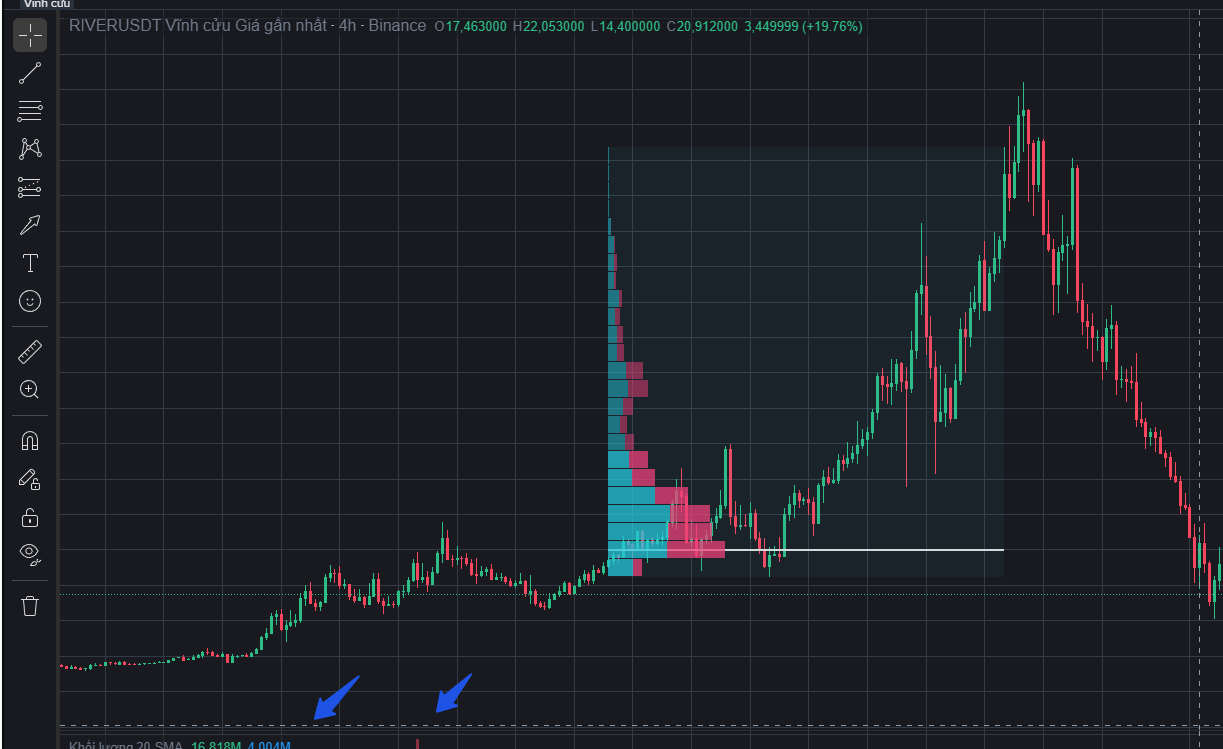
From the chart above, we can easily see the price support points of a specific level.
Using Volume Profile helps traders see the distribution and accumulation of trading volume at important price levels, thereby identifying potential support and resistance areas and even creating trading strategies based on accumulated trading volume.
#trading
