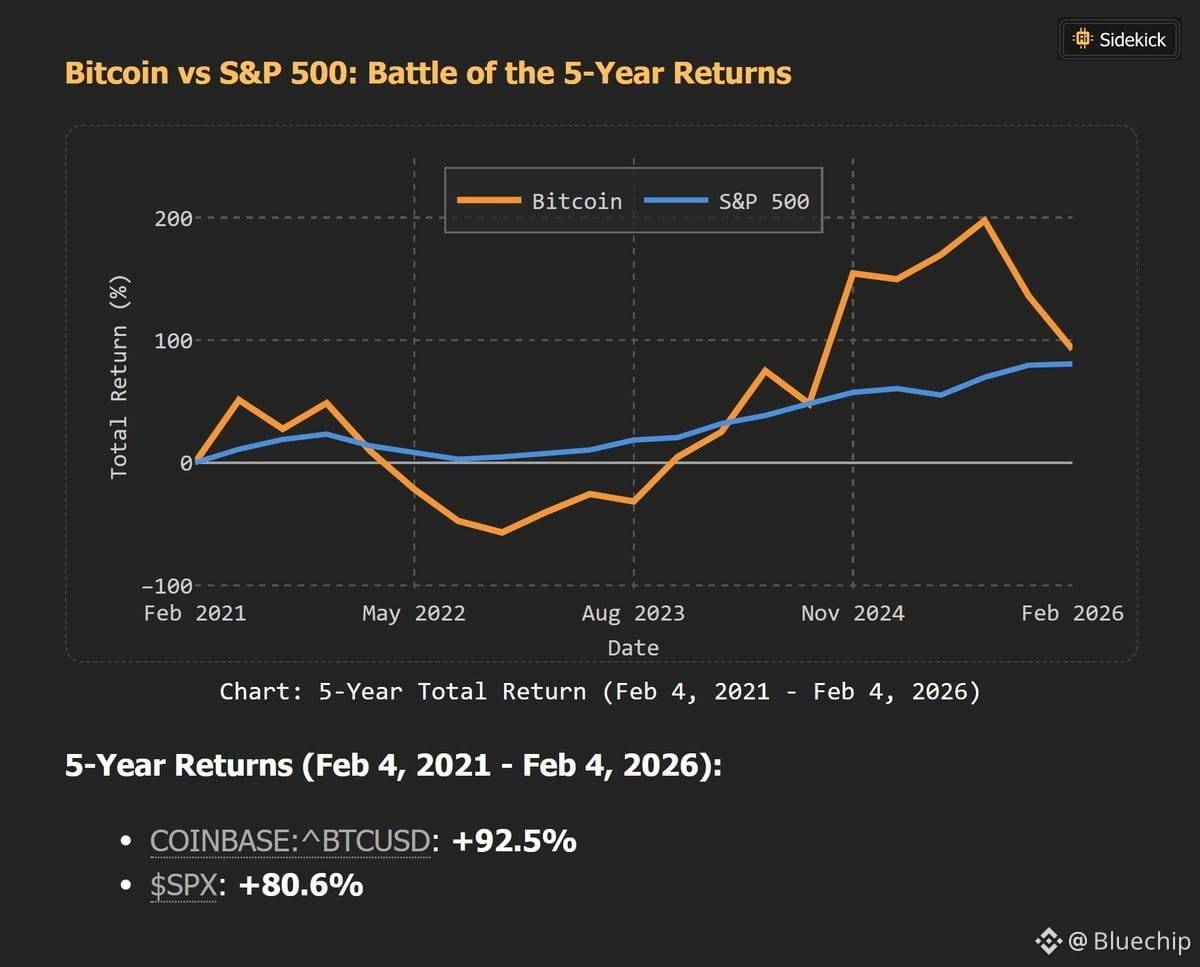
📈 1. BITCOIN VS S&P 500: 5-Year Returns Battle (Feb 2021 - Feb 2026)
The Revealing Chart:
· Period: February 4, 2021 → February 4, 2026 (exactly 5 years)
· Bitcoin (BTC): +92.5% total return
· S&P 500 (SPX): +80.6% total return
Performance Analysis:
Bitcoin Wins, But Just:
· Bitcoin Advantage: +11.9% over 5 years
· Volatility: Bitcoin extremely more volatile
· Risk/Reward: Less favorable for Bitcoin
Important Temporal Context:
· Start: February 2021 (Bitcoin ~$45K, S&P ~3,800)
· End: February 2026 (Bitcoin ~$71K, S&P ~6,850)
· Bitcoin has survived: Bear market 2022 + correction 2025-2026
Lessons:
1. Bitcoin outperforms the S&P 500 long term
2. But volatility is huge
3. Critical entry timing
---
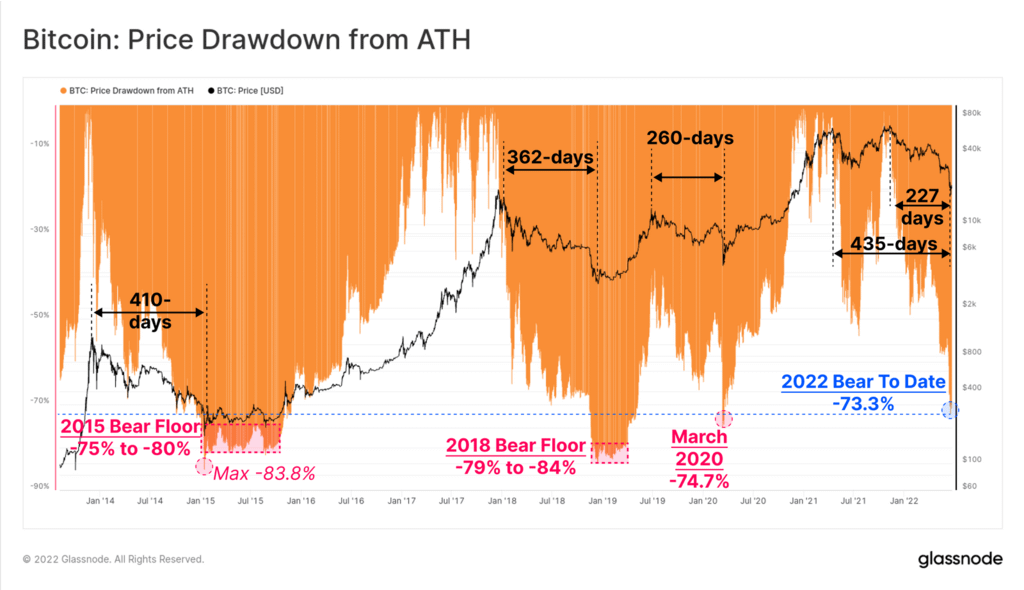
📉 2. HISTORICAL DRAWDOWNS: How Much Lower Can Bitcoin Go?
Worst Drawdowns Table:
Drawdown Event since ATH BTC Price Corresponding Level (ATH $126K)
2018 Bear Floor -79% to -84% $26K-$21K $26K-$20K
2022 Bear -73.3% $34K $34K
March 2020 -74.7% $32K $32K
Historical Max -83.8% $20K $20K
Current Position (February 2026):
· ATH: $126,198 (October 2025)
· Current price: ~$71,000
· Current drawdown: -43.7%
Possible Scenarios:
Optimistic Scenario (40%):
· Drawdown similar to 2022 (-73.3%)
· Bottom: $34K
· Still -52% from current level
Medium Scenario (35%):
· Drawdown similar to 2020 (-74.7%)
· Bottom: $32K
· Still -55% from current level
Pessimistic Scenario (25%):
· Maximum drawdown (-83.8%)
· Bottom: $20K
· Still -72% from current level
Conclusion: Historically, Bitcoin can still drop 50-70% from current levels.
---
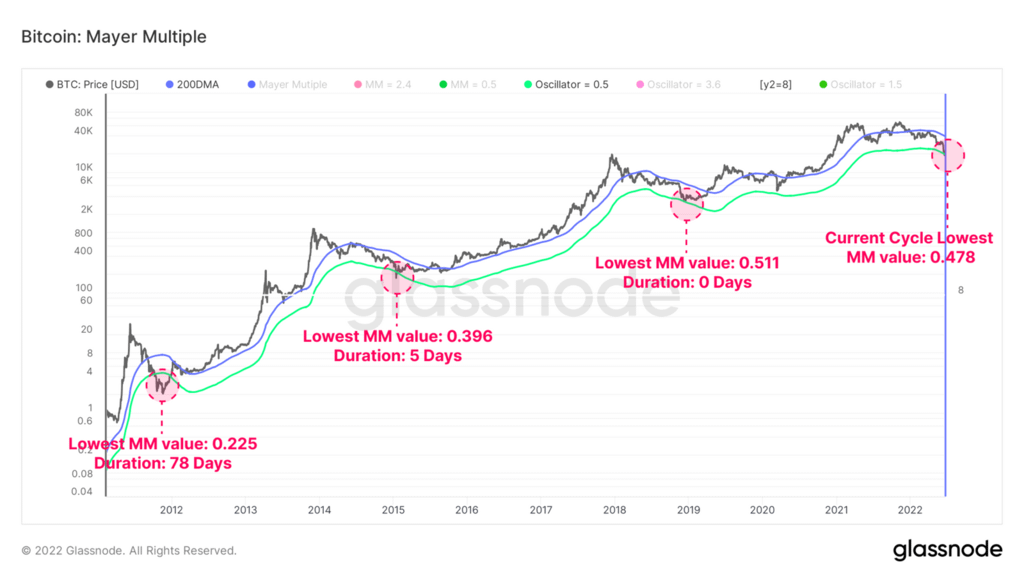
🔄 3. CYCLE METRICS: Mayer Multiple and Oscillators
Mayer Multiple (MM):
· Formula: Price / 200-day Moving Average
· Signals:
· MM > 2.4: Overbought (sell)
· MM < 0.5: Undervalued (buy)
· Current (est.): ~1.1 (neutral)
Oscillator:
· Critical levels:
· 0.5: Accumulation zone
· 1.5: Neutral
· 3.6: Distribution zone
· Current: ~1.0 (slightly below neutral)
Data Analysis of the Chart:
Clear Cyclical Pattern:
1. 2012-2016: Accumulation (low oscillator)
2. 2017-2021: Expansion (ascending oscillator)
3. 2022-2026: Correction (descending oscillator)
Current Position in the Cycle:
· End of corrective phase
· Oscillator approaching accumulation zone (0.5)
· But not yet in "buy" zone
--- $BTC
$BTC
🎯 SYNTHESIS OF 3 DATASETS:
The Big Picture:
1. Relative Performance:
· Bitcoin beats the S&P long term (+92.5% vs +80.6%)
· But volatility makes timing crucial
2. Drawdown Risk:
· Current drawdown: -43.7% (historically moderate)
· Potential bottom: $20K-$34K (still -52% to -72%)
· Psychological support: $30K (2021 level)
3. Position in the Cycle:
· Phase: Advanced correction
· Metrics: Approaching accumulation zone
· Not yet at "maximum fear"
---
💡 DATA-BASED INVESTMENT STRATEGY:
Strategic Accumulation Levels:
Level 1: $45,000 (MM ~0.8)
· Conservative entry
· -37% from current
· Corresponds to drawdown -64%
Level 2: $35,000 (MM ~0.65)
· Aggressive entry
· -51% from current
· Drawdown -72% (near 2022)
Level 3: $25,000 (MM ~0.5)
· Maximum accumulation
· -65% from current
· Drawdown -80% (near 2018)
Action Plan:
For Investors:
· Now: Wait (MM 1.1 too high)
· At $45K: DCA 25% of capital
· At $35K: DCA 50% more
· At $25K: Remaining all-in
For Traders:
· Short: Up to $45K support
· Long: Wait for rebound from $45K
· Range trade: $45K-$65K next phase
---
⚠️ IDENTIFIED RISKS:
Historical Risk:
1. Drawdown not finished (history suggests -70% minimum)
2. Recovery time: 2-3 years after bottom
3. Permanent loss possible if panic selling
Cycle Risk:
1. MM not yet in buy zone (0.5)
2. Oscillator not at the bottom
3. Sentiment not at "capitulation"
---
📊 PROJECTION 2026-2027:
Probable Scenario:
· Q2-Q3 2026: Test $45K-$35K
· Q4 2026: Bottom formation $30K-$35K
· 2027: Start of institutional accumulation
· 2028-2029: New bull market
Long Term Goals:
· 2030: Retest ATH $126K
· 2032: New ATH $200K+
· Condition: Survive current drawdowns
---
💎 FINAL CONCLUSION:
Historical data is clear:
1. Bitcoin outperforms long term (+92.5% vs S&P 500)
2. But drawdowns are brutal (-80% possible)
3. We are not at the bottom (MM 1.1 vs 0.5 target)
4. Patience will be rewarded
Your best strategy:
· Wait for accumulation levels ($45K, $35K, $25K)
· Gradual DCA
· Ignore media noise
· Focus on metrics, not emotions
Reminder: Bitcoin has survived worse. This is not the end, it’s a cycle.
---
Data: Coinbase, Bitcoin history, cycle metrics. Analysis based on historical patterns. DYOR. No financial advice.
#bitcoin #HistoricalData #MarketCycles #InvestmentStrategies y #DrawdownAnalysis #BitcoinVsSP500 #trading #CryptoResearch $ETH $BNB


