Bitcoin (BTC) has dropped about 13% in just four days, from $79,300 to $63,844. The price is currently trading below $69,000 — the peak of the 2021 growth cycle, which many investors consider an important 'support'.
Notably, this decline is accompanied by a marked slowdown in the derivatives market. In the past seven days, BTC open interest has plummeted by more than $10 billion, indicating that participation and leverage in the market are rapidly shrinking.
In this context, analysts are shifting their focus to long-term technical areas and on-chain indicators to assess whether BTC is nearing a major reversal point.
Why is the $69,000 mark particularly important?
The $69,000 mark was the peak of the bull market in 2021. In previous cycles, old peak areas often become 'support levels' when the market declines. For instance, in the previous cycle, Bitcoin created a bottom around the 2017 peak (around $19,600), before dropping to about $16,000 in November 2022.
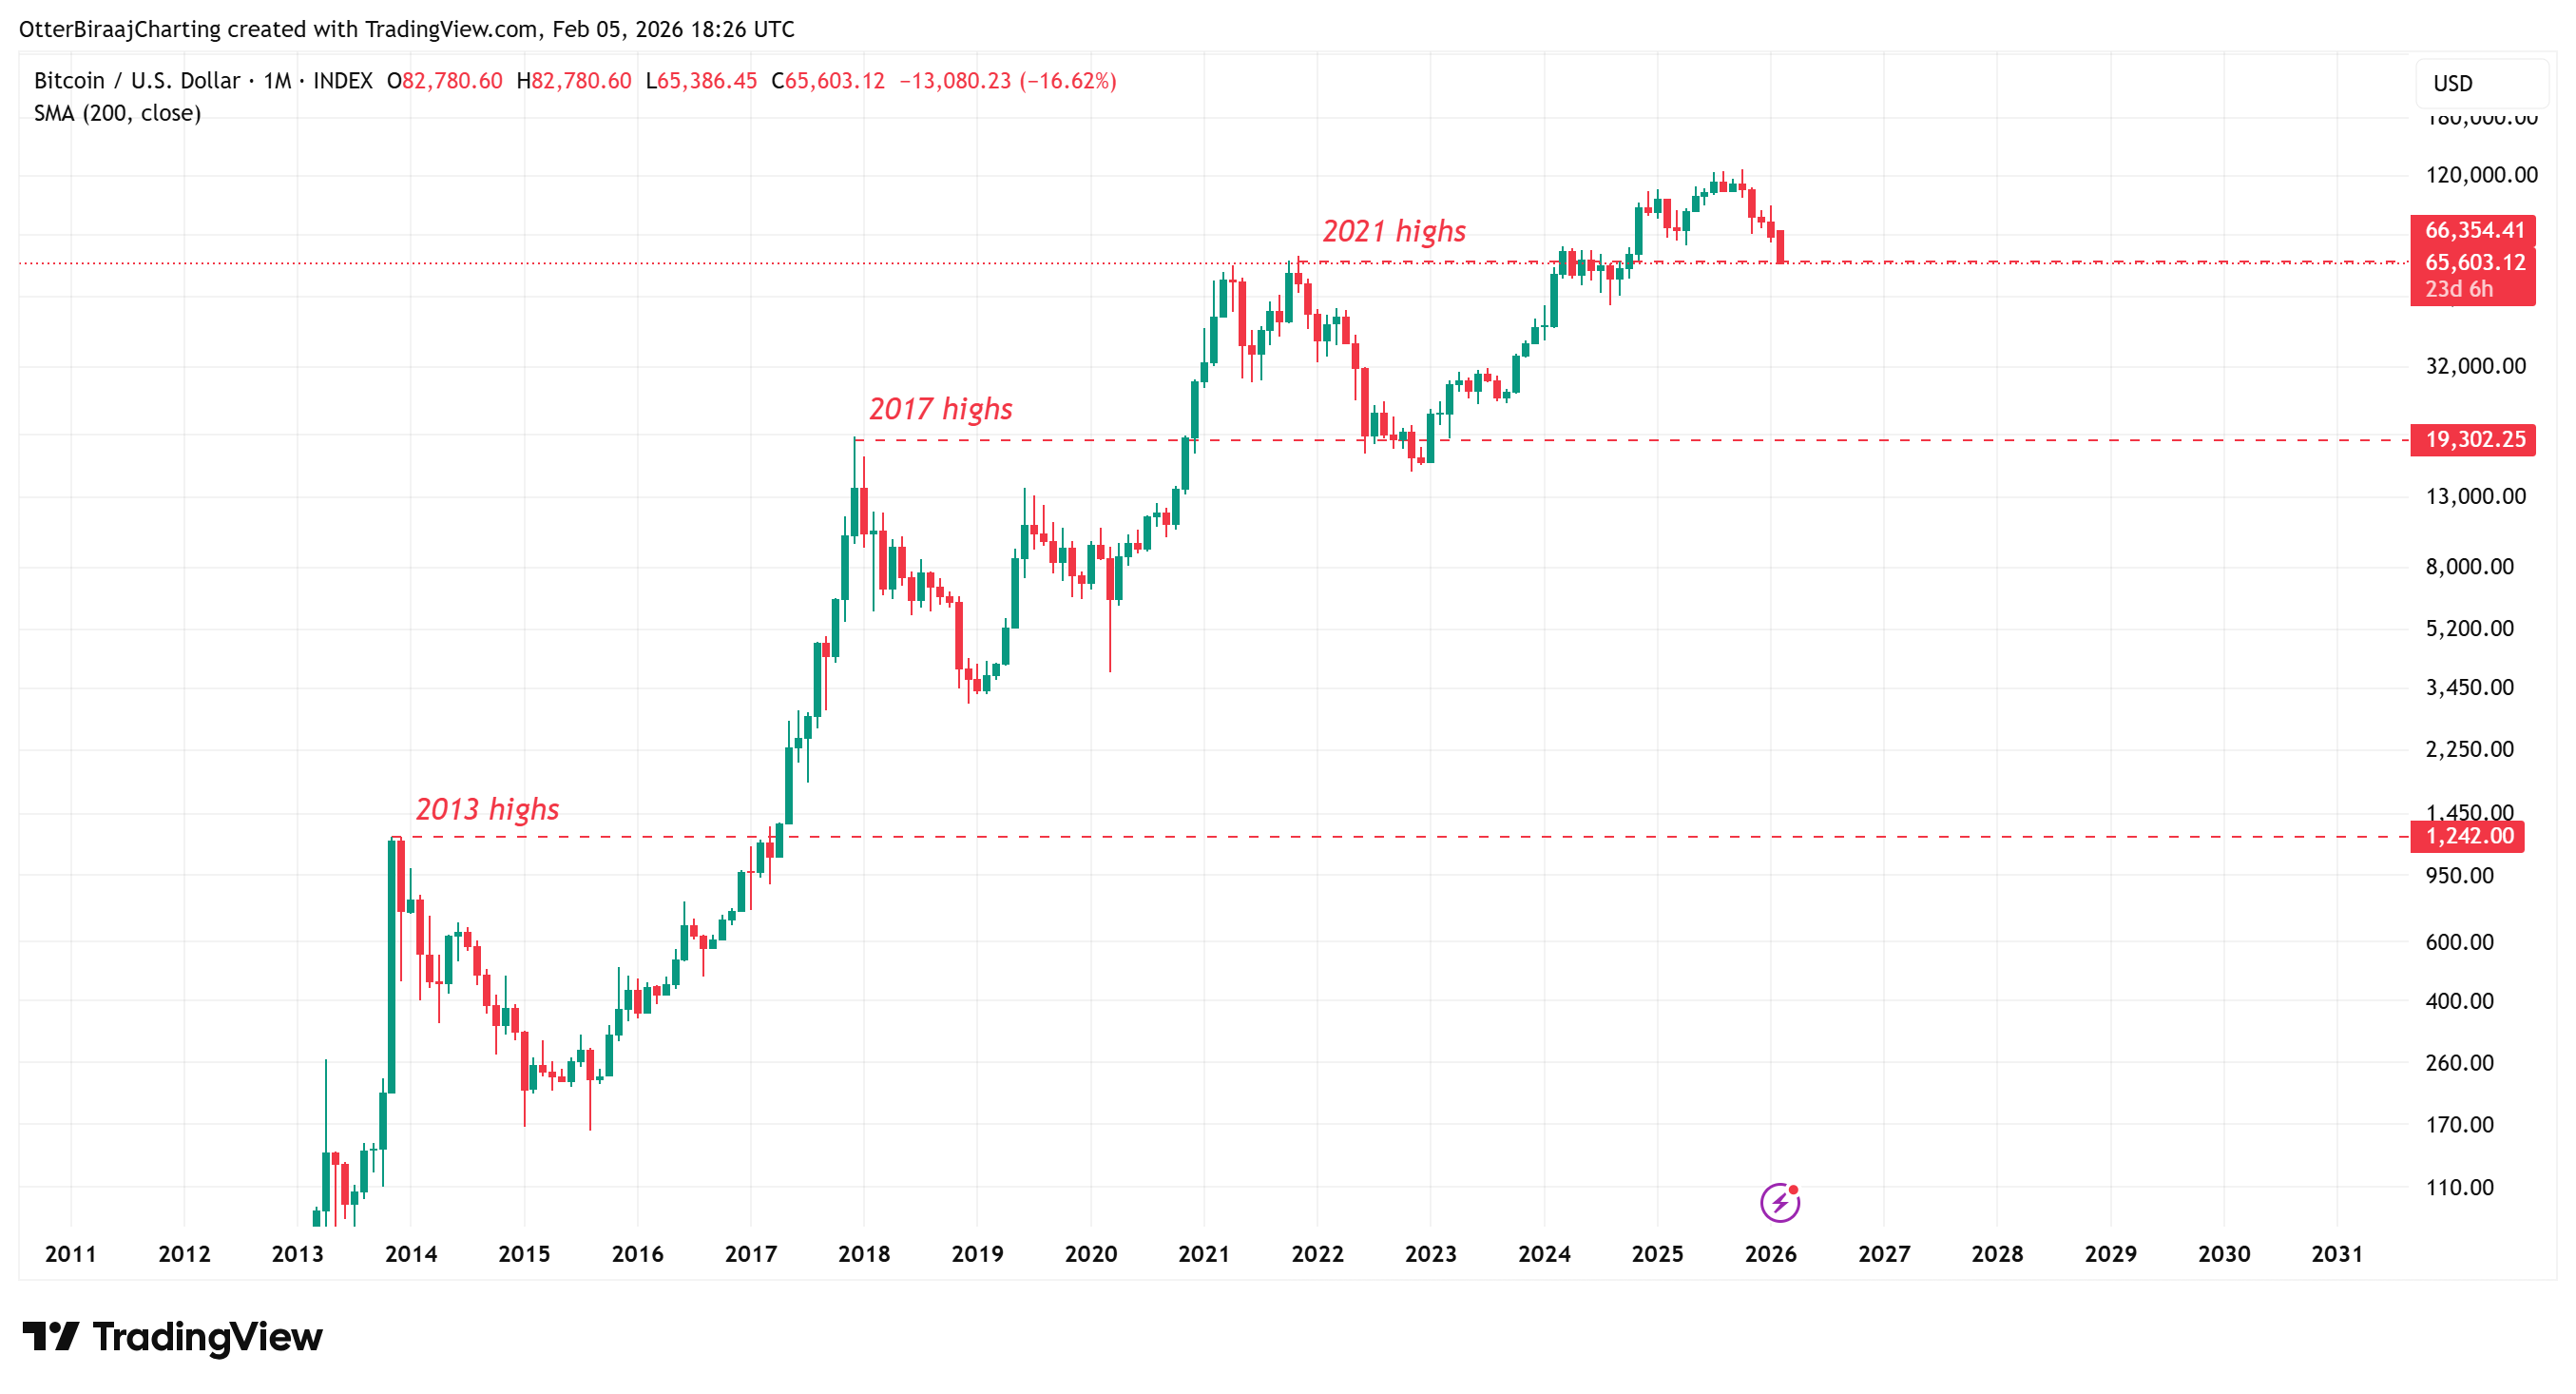 Bitcoin chart over one month | Source: Cointelegraph/TradingView
The fact that BTC has now fallen below $69,000 may repeat that pattern. However, historical data also shows that prices sometimes drop below old peaks before forming the final bottom — so the risk of further decline cannot be ruled out.
André Dragosch (Head of Research at Bitwise Europe) noted that a significant portion of recent trading has focused around the $58,000–$69,000 range. This area coincides with the 200-week moving average around $58,000, thus reinforcing that this is a key demand zone technically.
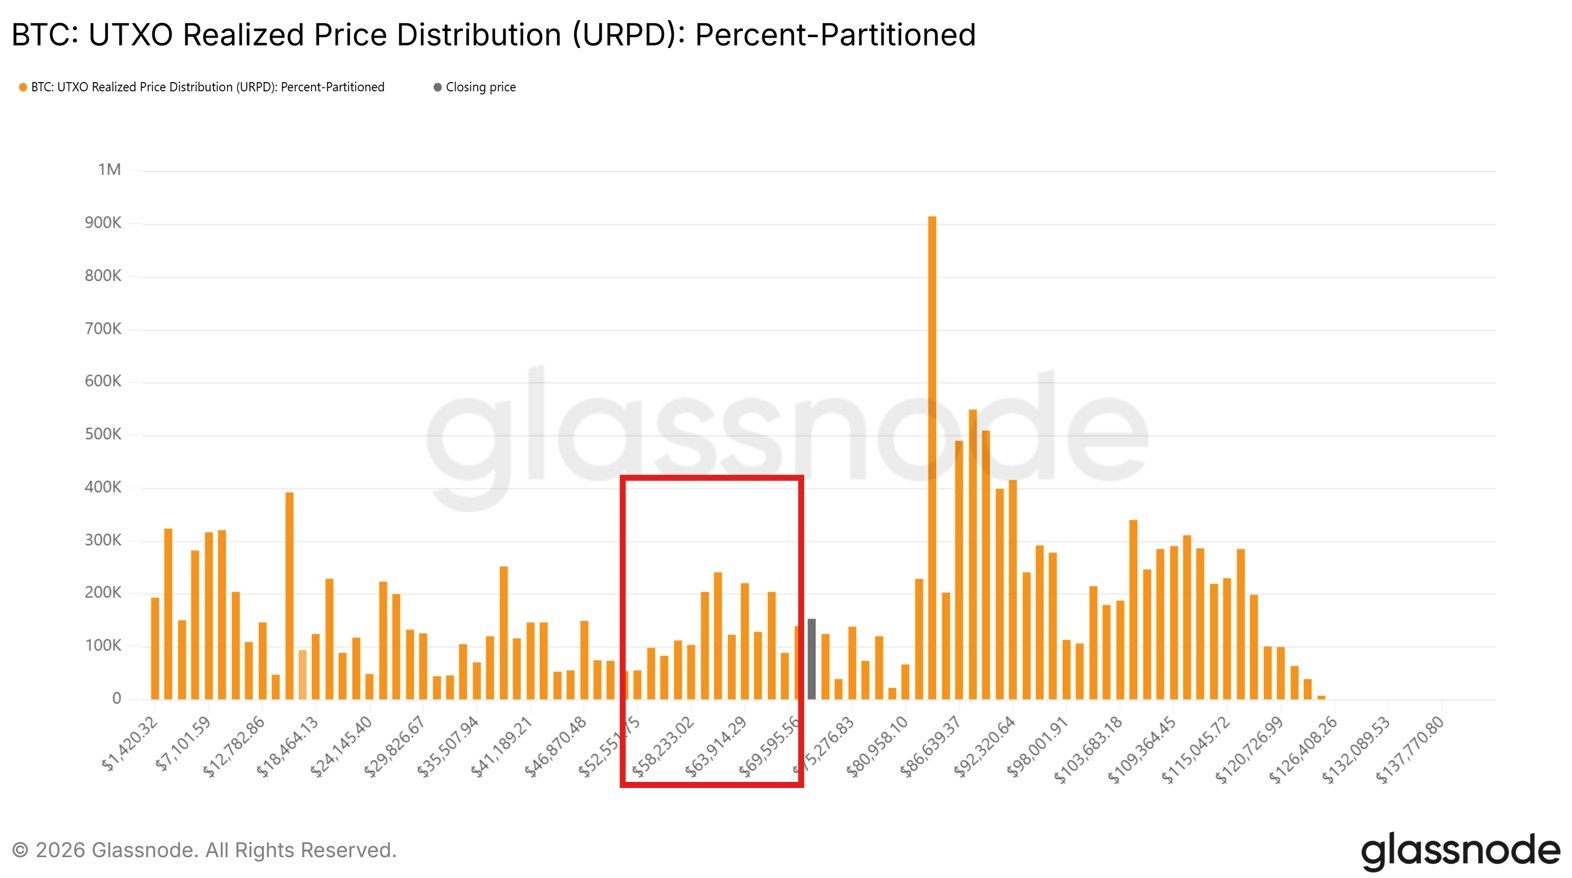 Bitcoin URPD chart | Source: Glassnode
From a short-term supply-demand perspective, analyst exitpump noted that the order book is showing large buy orders in the $68,000–$65,000 range, reflecting potential buying pressure as the market adjusts.
BTC signals rare 'oversold'
According to analyst Subu Trade, the weekly RSI index of Bitcoin has dropped below 30 — a very rare 'oversold' threshold. Historically, BTC has only reached this level four times, and each time it recorded an average recovery of about 16% in the four days following.
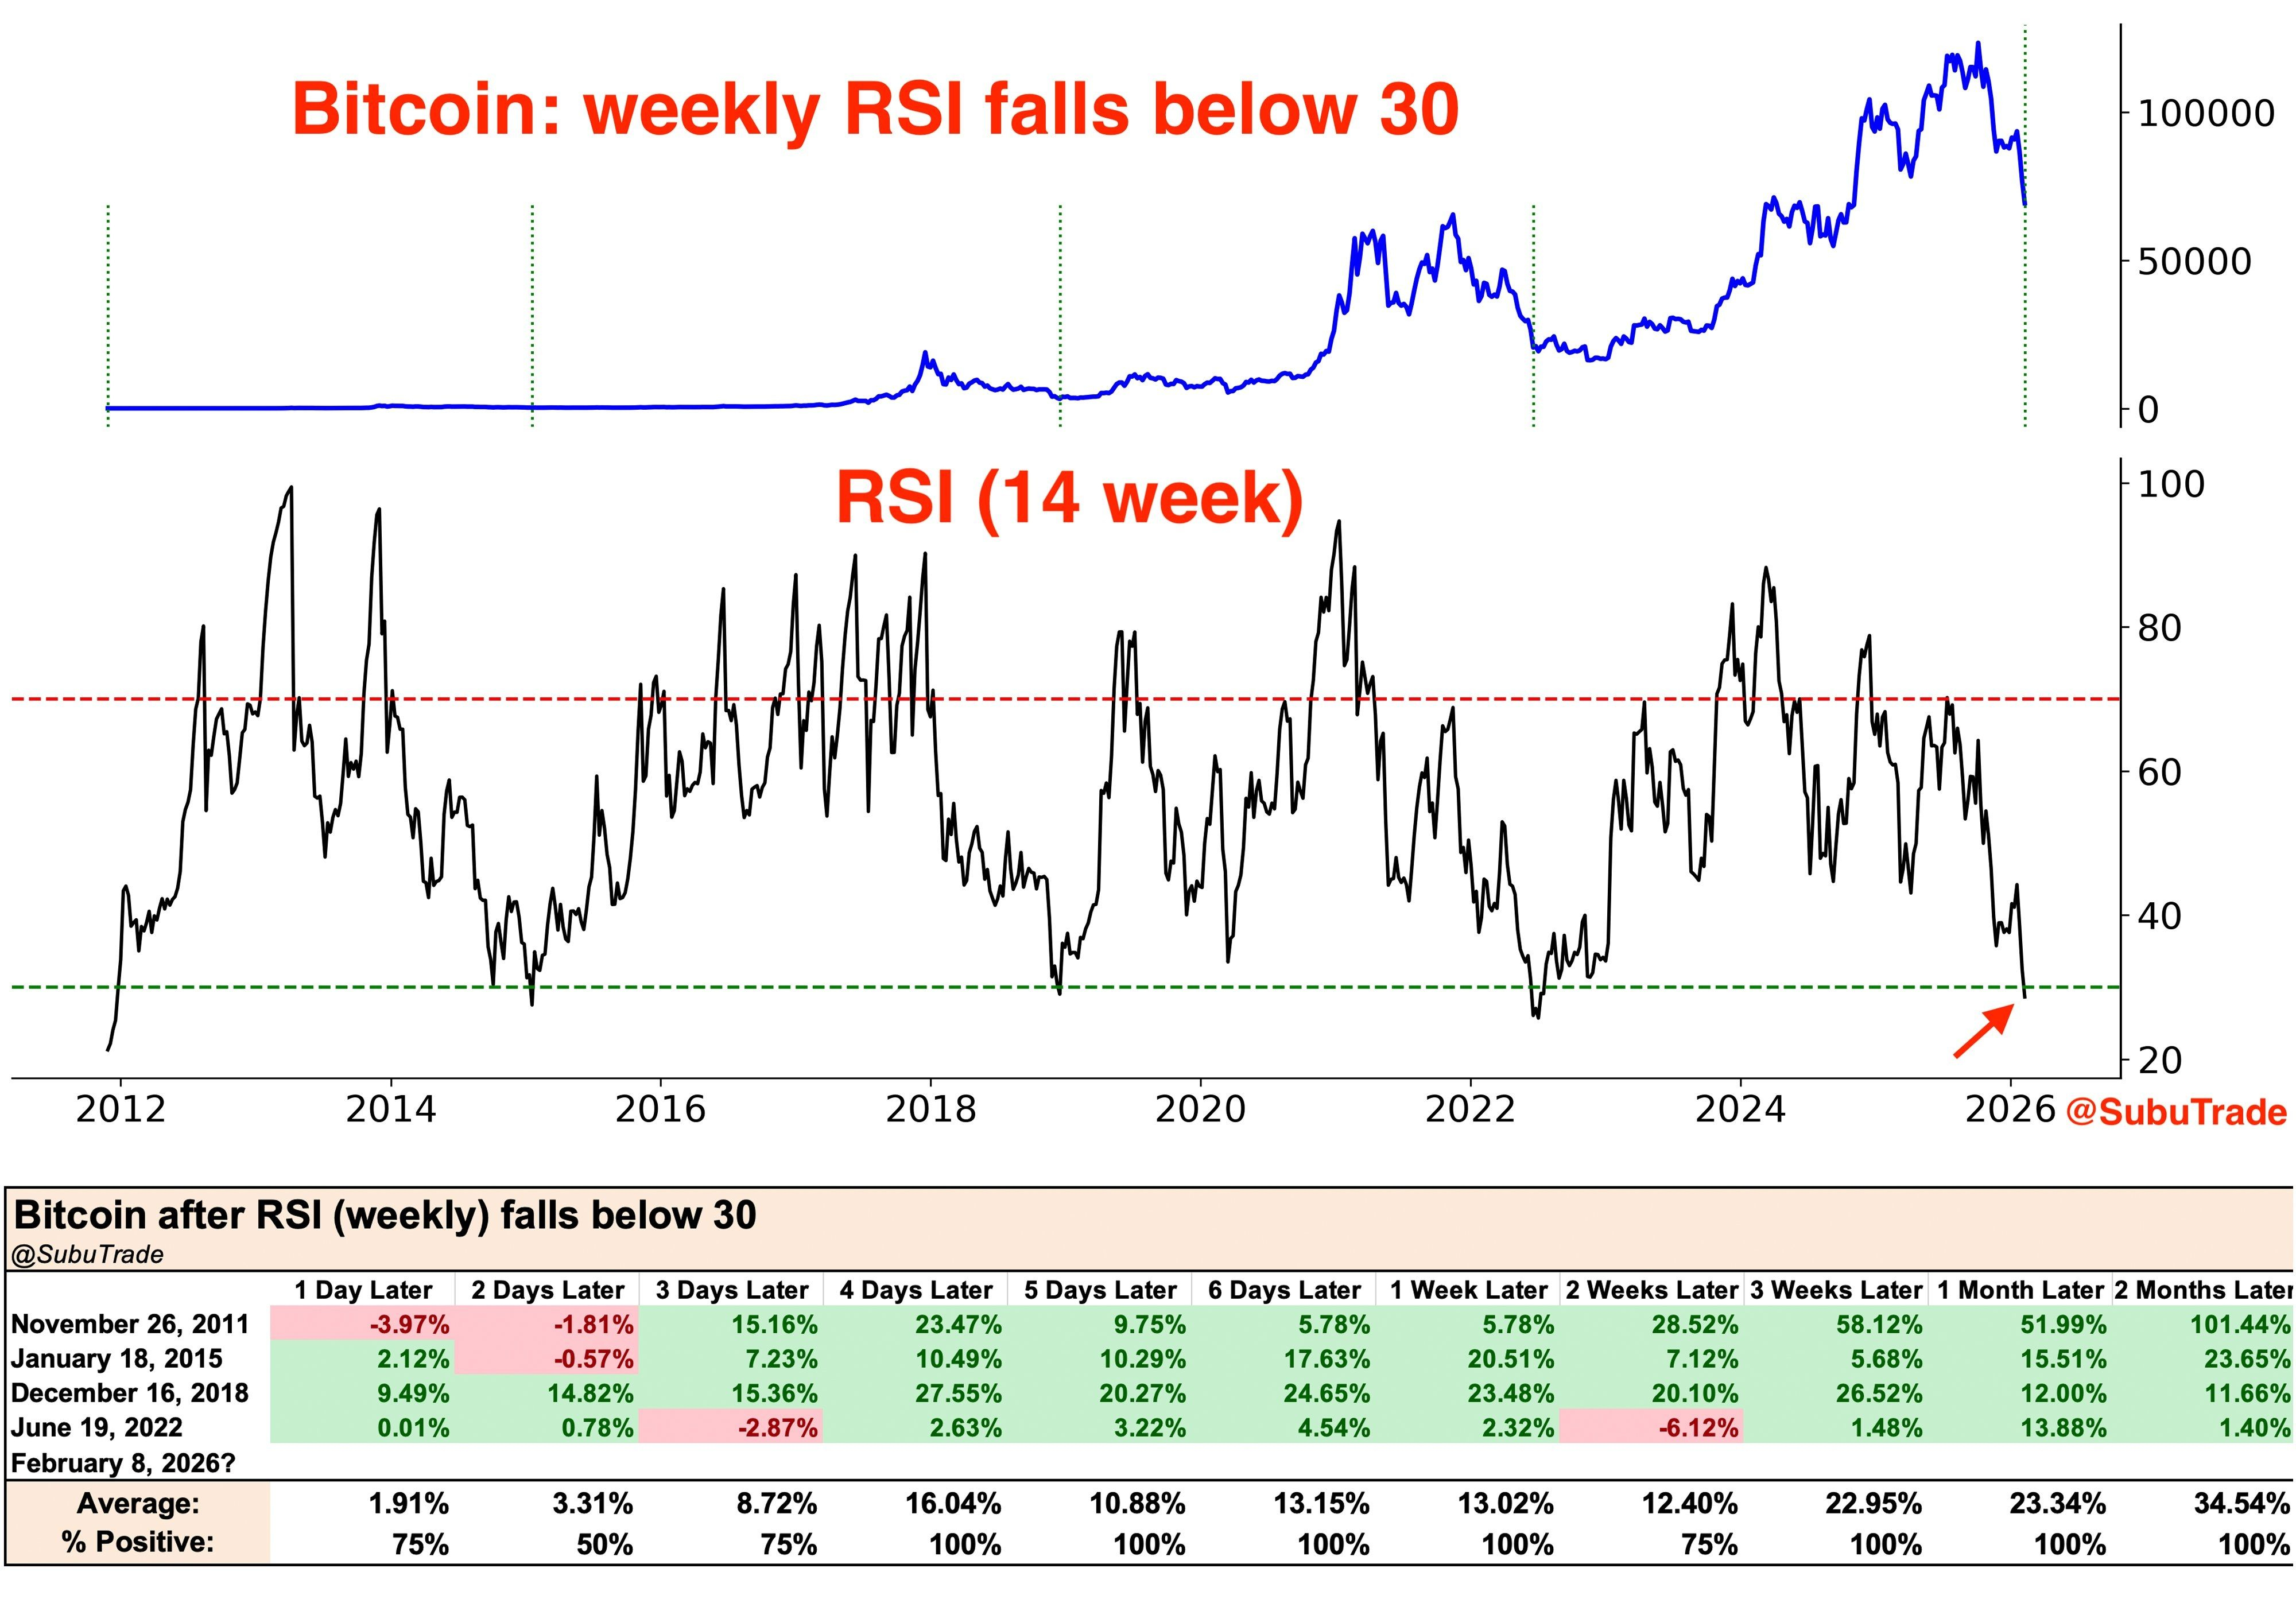 Weekly Bitcoin chart and RSI index comparison | Source: X
Additionally, analyst MorenoDV noted that the on-chain indicator aNUPL (net unrealized profit/loss) has turned negative for the first time since 2023, meaning that the average holder is falling into a state of loss. Similar periods in 2018–2019, 2020, and 2022–2023 have paved the way for BTC recoveries.
Although a technical rebound may not appear immediately, MorenoDV emphasized that the deterioration of market sentiment this time is occurring significantly faster than in previous cycles, and believes that:
"This rapid transition indicates that sentiment is being 'reestablished' abruptly, rather than gradually declining — which could make the capitulation phase shorter."
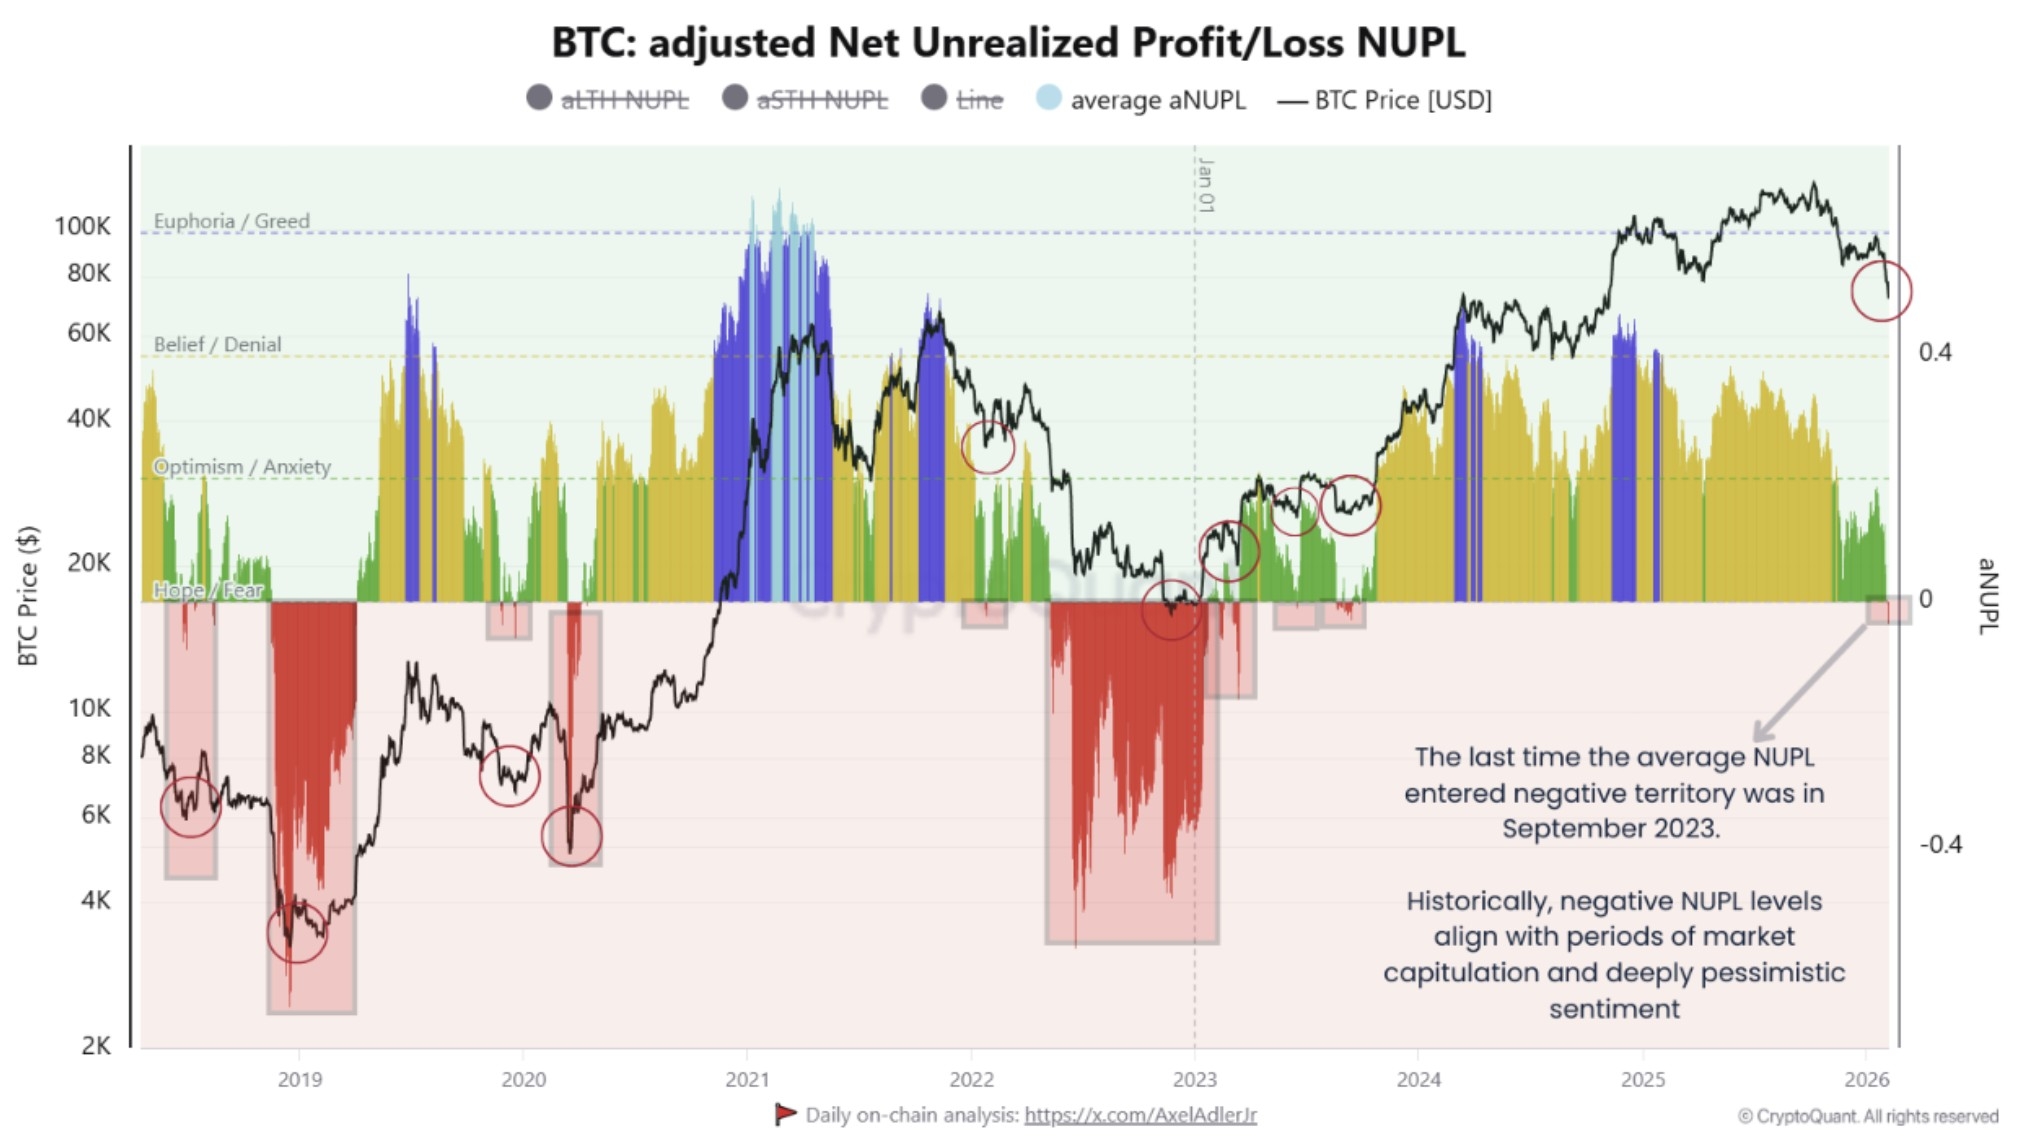 Adjusted net unrealized profit/loss (NUPL) of Bitcoin | Source: CryptoQuant
https://coinphoton.com/bitcoin-giam-xuong-duoi-64-000-do-la-khi-luc-ban-tang-manh.html
