The dominant question in the cryptocurrency market is: "How far will this bear market reach?" Bitcoin, which has recorded a 17% decline this year, is facing a perfect storm of huge institutional outflows from ETFs ($12 billion in three months), global risk aversion, and a lack of clear regulatory support. However, this scenario of intense selling by major players may pave the way for a future reversal. Now the focus is on identifying the accumulation zone – the level at which selling pressure is exhausted and from which 'whales' and funds may re-enter with intensity, signaling the end of the downward trend.
MARKET CYCLE SIGNALS
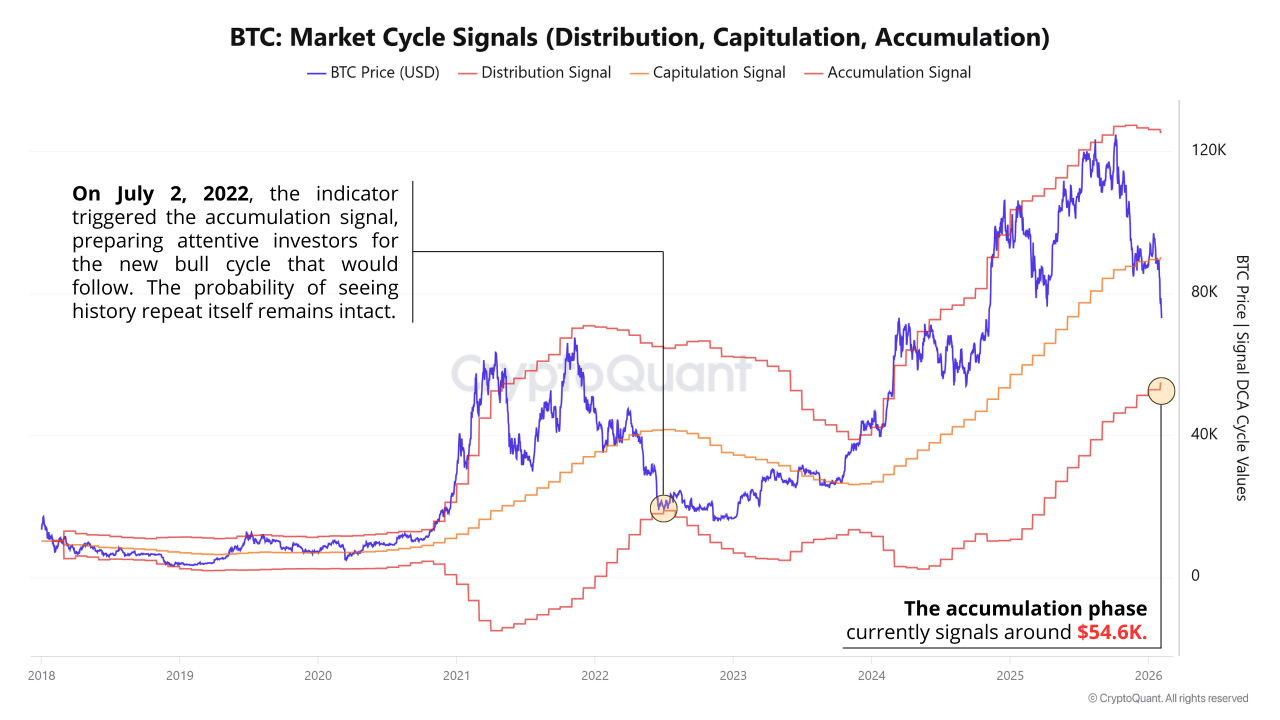
To navigate through these turbulences and predict the turn, an educational indicator based on on-chain data proves to be crucial: BTC: Market Cycle Signals (Distribution–Capitulation–Accumulation).
Interprets the Bitcoin market cycle by dividing it into three distinct phases based on monthly Bollinger bands:
◾ Distribution → Price touches the upper band (euphoria).
◾ Capitulation → Price crosses the 20-month moving average downward and approaches the lower band (panic).
◾ Accumulation → Price finds support at the lower band and consolidates (buying phase).
The current price proximity to the band signaling the beginning of the accumulation phase, situated around 54.6K $, suggests that we are in a critical transitional phase between Capitulation and Accumulation. This level, defined through historical analysis of BTC: Market Cycle Signals, establishes itself as the main candidate for the lower region of this bear market.
CONCLUSIONS
Predicting market movements is a strategic privilege. Tools such as BTC: Market Cycle Signals transform complex on-chain data into clarity, turning the investor from a spectator into the architect of their own accumulation. While most wait for the obvious turn, you will already be positioned in the region where the cycle is reborn.