The market $BTC is experiencing "fiery" days as prices plummet from the peak of 98,000 USD to the area of 72,000 USD. Deleveraging pressure, depleted Spot liquidity, and net outflows from institutional funds are weighing heavily on investor sentiment. The biggest question right now: Where is the last support point for BTC?
Below is the overall picture decoded through the lens of On-Chain data and the derivatives market.
1. Market Position: Breaching the 'Psychological Floor'
$BTC has officially confirmed the bearish trend and is currently trading below the market's realized average (Realized Market Mean Price).
New resistance level: After failing to recover the short-term position costs at 94,500 USD, the realized average of 80,200 USD has now become a tough resistance ceiling.
Fragile state: The breach of this critical support confirms that the market structure has weakened since the end of November. This pattern recalls the early part of 2022: shifting from accumulation to deep correction.
Long-term support: Historically, the actual price level of around 55,800 USD is usually where long-term investment capital tends to return.
2. Searching for the Bottom: Three Potential Support Zones
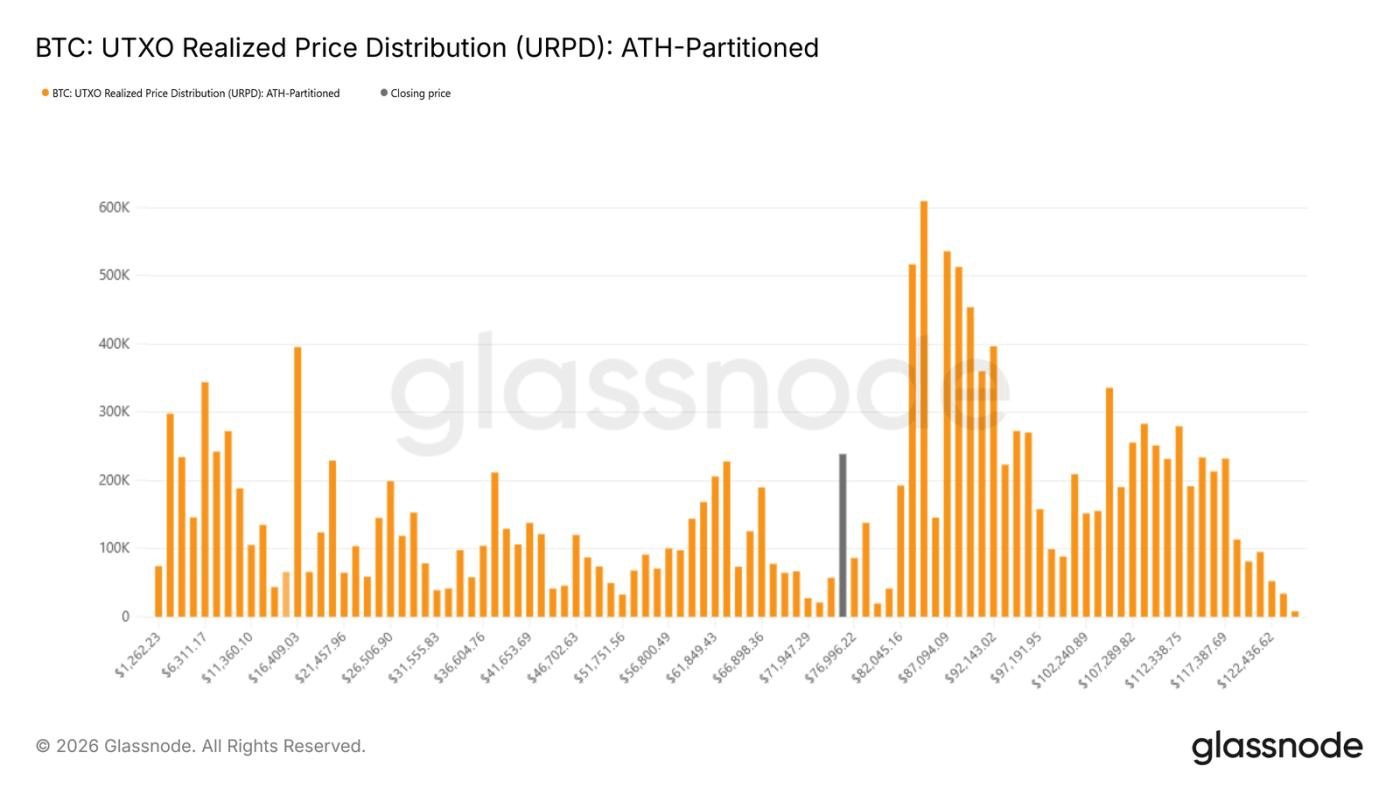
The actual price distribution data of UTXO (Unspent Transaction Output) indicates glimmers of hope for bottom formation:
Early accumulation zone: Signs of position formation have appeared in the price range of 70,000 – 80,000 USD.
Safety buffer zone: A large amount of positions being held (High-volume node) lies in the range of 66,900 – 70,600 USD. History shows that these dense price concentration zones often serve as a 'shield' against short-term declines.
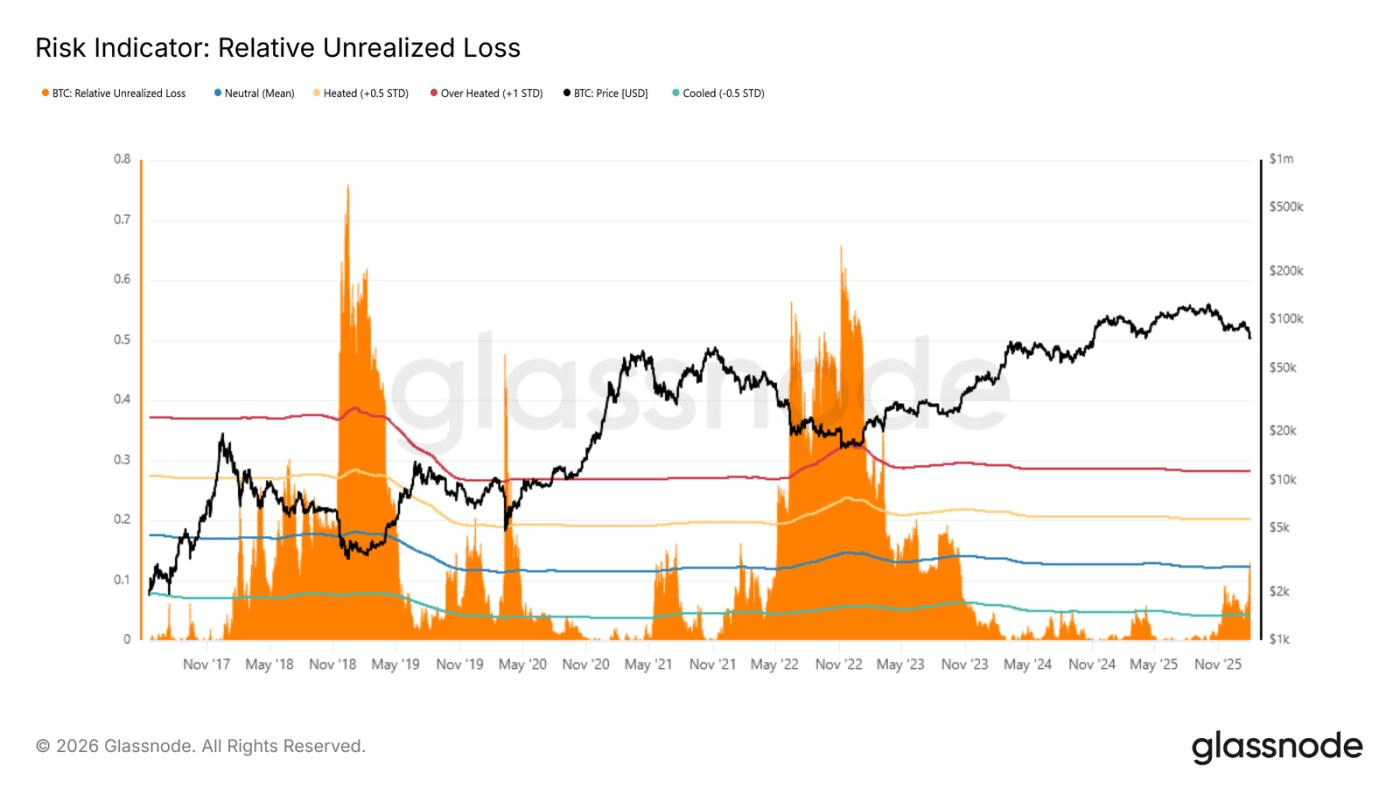
3. Pain Indicator: Investors are 'Bleeding'
The market is witnessing real panic through the Realized Loss index:
Damage level: Over the past 7 days, actual losses have exceeded 1.26 billion USD per day.
Historical comparison: During the recent short-term recovery from 72,000 USD, losses at one point reached 2.4 billion USD/day. These extreme figures are often signals of seller exhaustion and indicate potential short-term reversal points.
Unrealized Loss Index: It has now surpassed the long-term average (around 12%), indicating significant pressure on peak long positions. However, it has yet to reach the 'disaster' level of 65-75% like the 2018 or 2022 cycle bottoms (unless a black swan event like LUNA/FTX occurs).
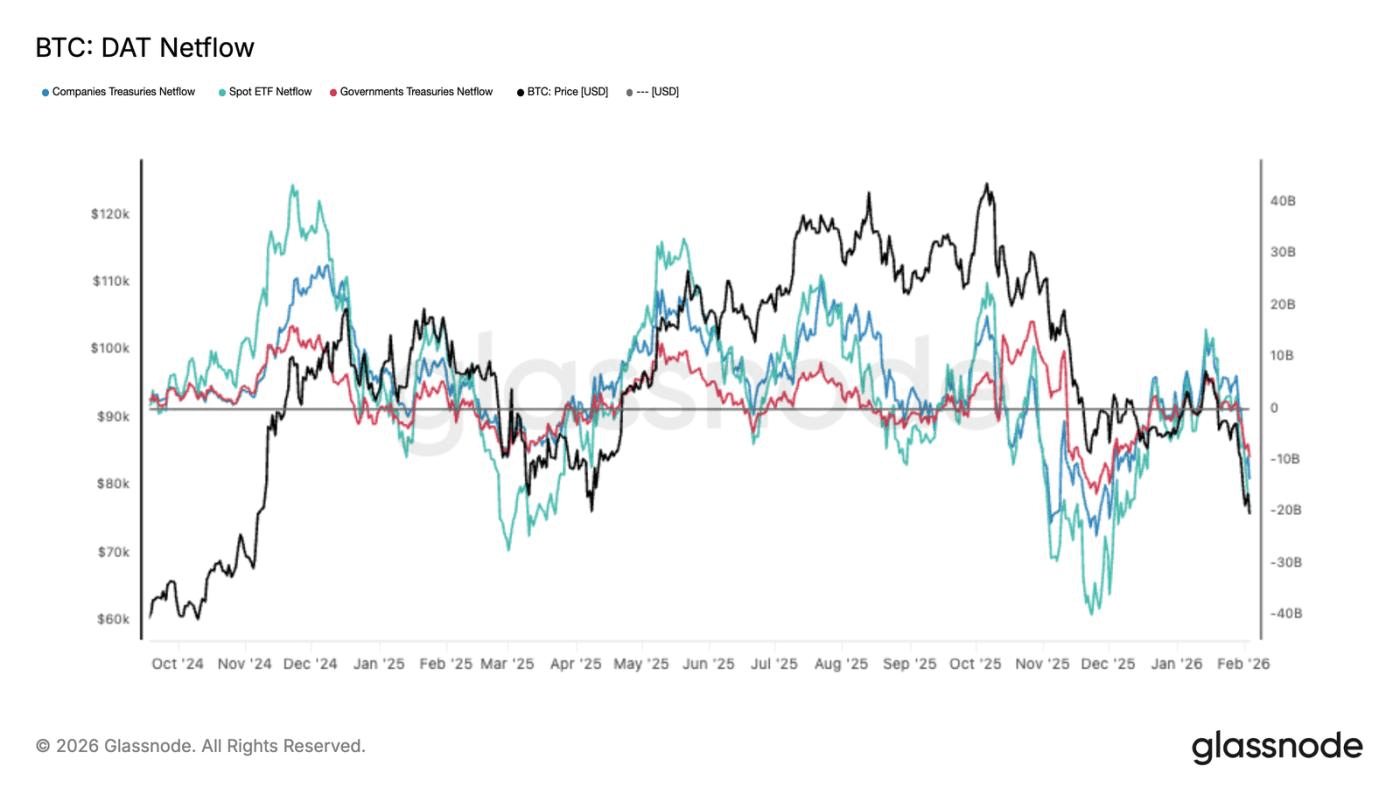
4. Cash Flow & Liquidity: The Terrifying Silence
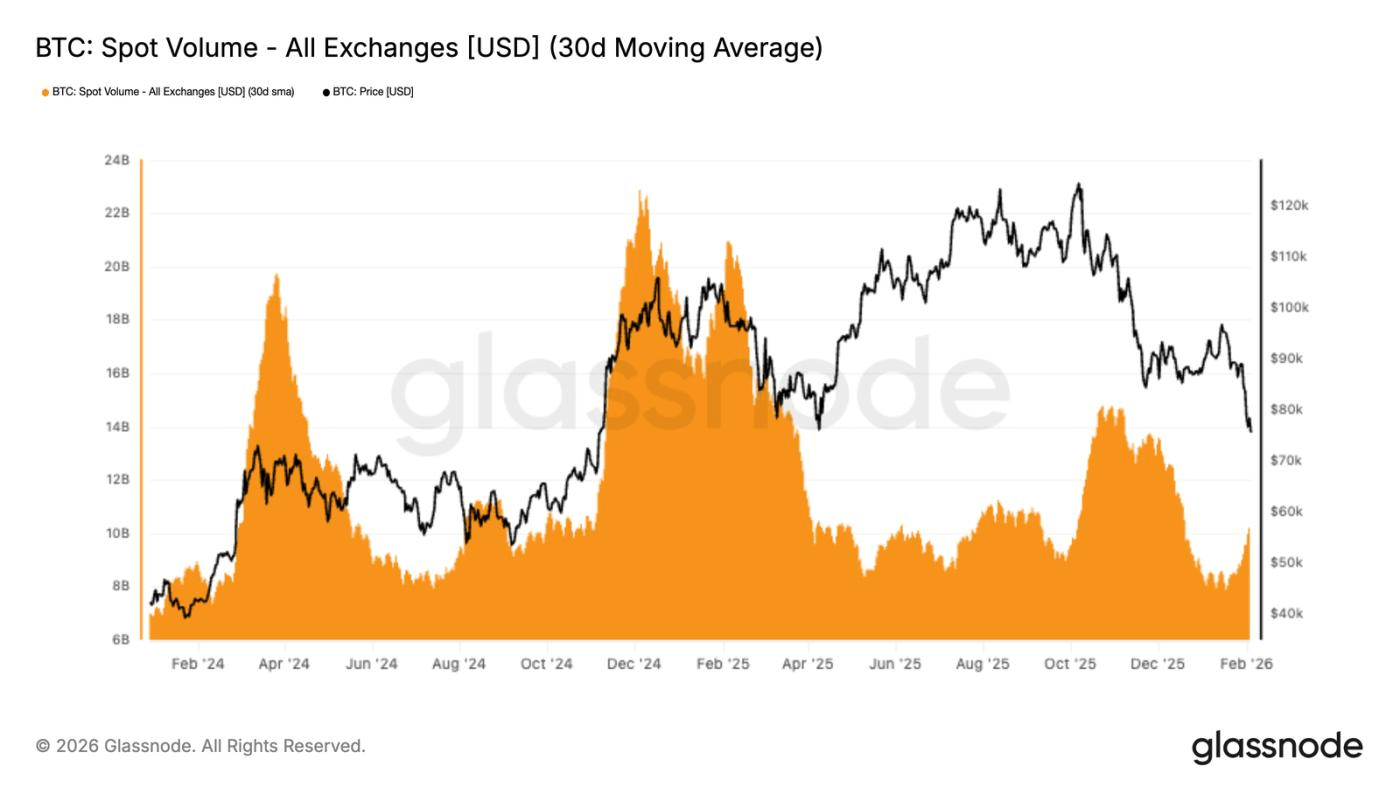
The key to the weakness lies in the absence of Spot buying pressure:
Stagnant volume: Although the price has sharply discounted from 98,000 USD to 72,000 USD, the average trading volume over 30 days has not increased significantly.
Institutional withdrawal: The flow of ETF Spot and related corporate/government funds is seeing outflows. This is in stark contrast to the previous bullish phase.
Consequences: The market lacks the capacity to absorb selling pressure. Any current recovery is merely technical, primarily due to a reduction in risk hedging positions rather than new inflows.
5. Derivatives Market: 'Volatility Bomb'
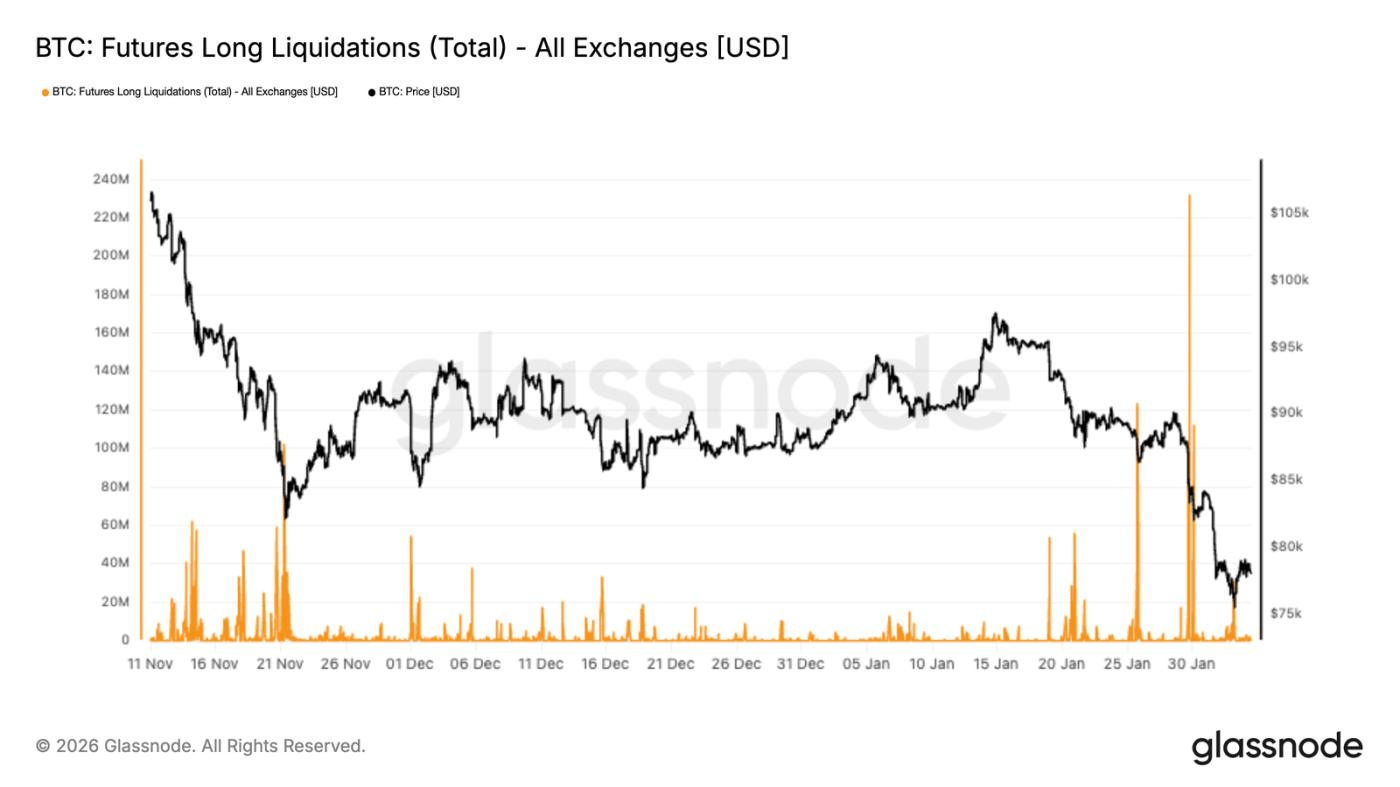
The futures and options market is sending signals of heightened risk:
Forced Deleveraging: The massive liquidation of Long positions is happening at the strongest level since the beginning of the downturn. This is a phase of mandatory deleveraging, causing prices to drop even further.
Short-term volatility spikes: As the price tests the 73,000 USD mark, implied short-term volatility (IV) rises to 70%. The entire volatility curve shifts upward, indicating that investors are willing to pay a high premium to 'buy insurance' for their assets.
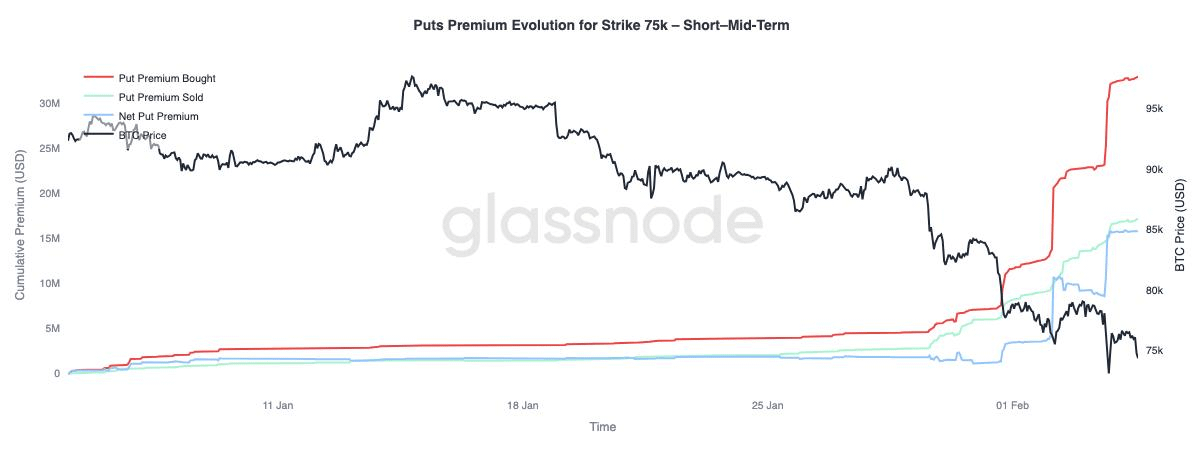
Overarching bearish sentiment:
The skew of Put options has widened compared to Call options.
Put options with a strike price of 75,000 USD have become the focal point, with the premium increasing sharply.
Negative risk: The risk premium for volatility has turned negative (-5 compared to +23 last month). This forces option sellers to hedge risk more frequently, inadvertently exacerbating price volatility pressure.
Conclusion: Awaiting Confirmation from Real Money Flow
Bitcoin is in a defensive state, caught between cut-loss pressure and technical support zones.
Positive: The price range of 66,900 – 70,600 USD is a strong support fortress. The deleveraging process is helping to clean up speculative bubbles.
Negative: Spot demand is too weak and institutional capital is withdrawing. Current recoveries are not sustainable.
Solution: The actual bottom will only be confirmed when and only when Spot buying pressure returns strong enough to absorb the selling supply. Until then, risks remain tilted to the downside, and any recovery should be viewed as a technical correction rather than a trend reversal.
