🔎 Technical analysis ETHUSDT (February 2026)
Short-term trends
Current price: around 2238 USDT (as of February 2, 2026).
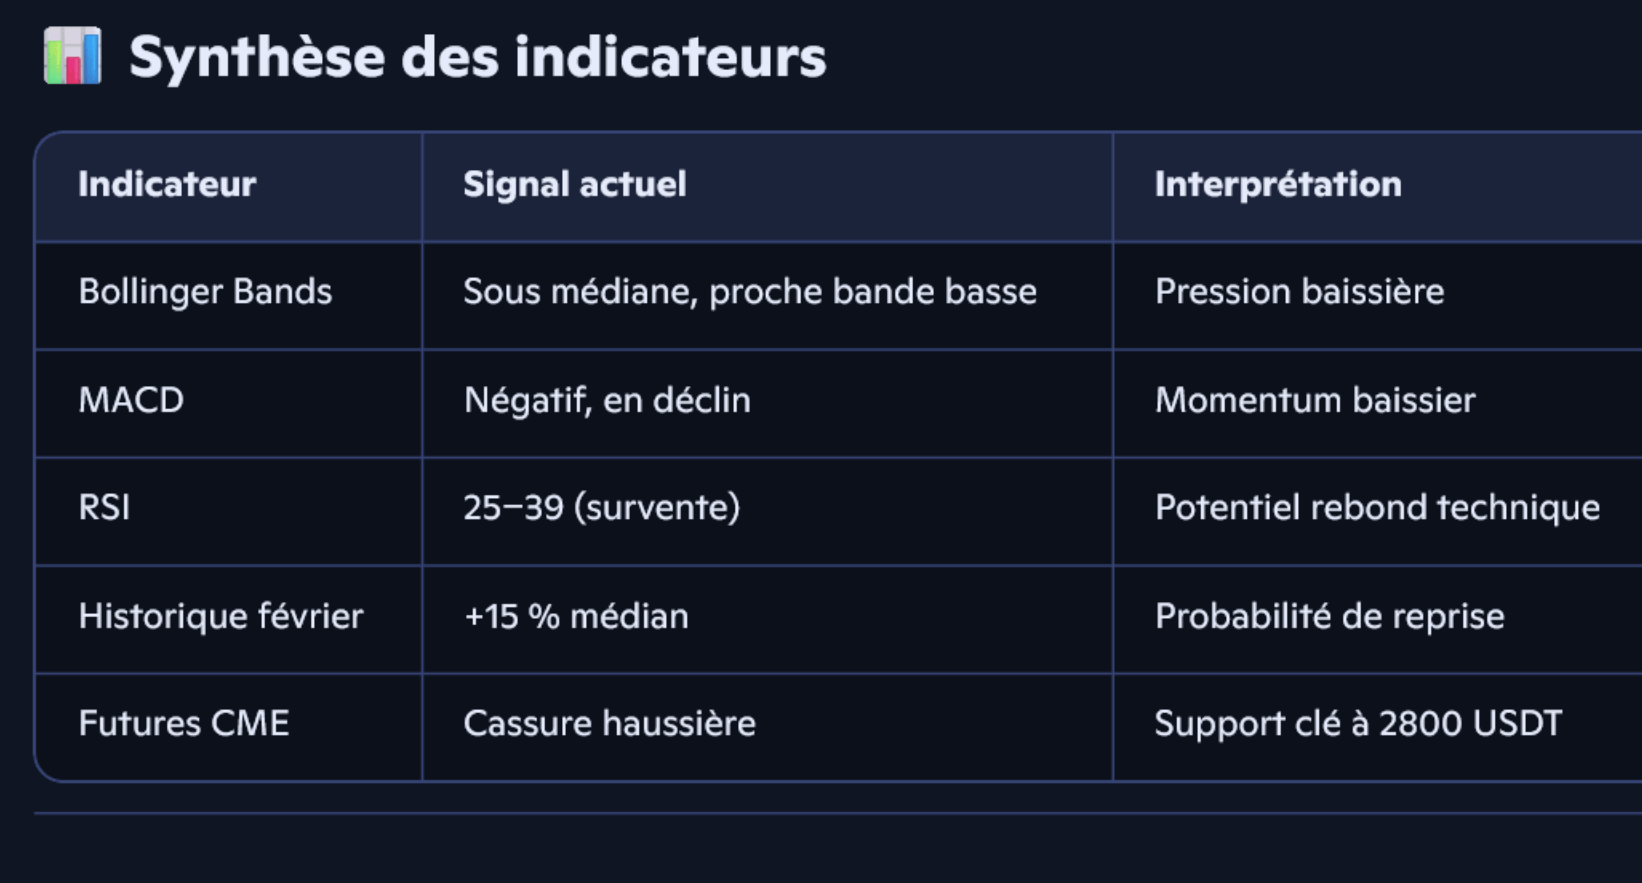
Bollinger Bands: break below the median band, approaching the lower band → strong bearish pressure.
MACD: negative histogram (-10.88), dif and dea lines declining → confirmed bearish momentum.
RSI: RSI6 at 25 and RSI14 at 39 → oversold zone, possible signal of technical rebound.
Medium-term trends
Recent performance: ETH lost 7% in January 2026, contrasting with its historical trend (+32% on average in January).
February history: median gains of +15% since 2016. But in 2025, a similar setup had led to a drop of 32–37%.
CME futures: constructive technical structure with a breakout of a descending wedge and key support around 2800 USDT.
🎯 Conclusion
Ethereum is currently under pressure with a dominant bearish bias confirmed by MACD and Bollinger. Nevertheless, oversold conditions and favorable seasonality in February open the door to a technical rebound. Traders should monitor:
Immediate support: 2130–2170 USDT.
Key resistance: 2400–2500 USDT.
Pivot zone: 2800 USDT (CME futures).
👉 Suggested strategy: caution in the short term, but swing trade opportunity if ETH confirms a rebound above 2300 USDT.
#Binance , #Crypto #cryptocurreny #ETH #ADPDataDisappoints
