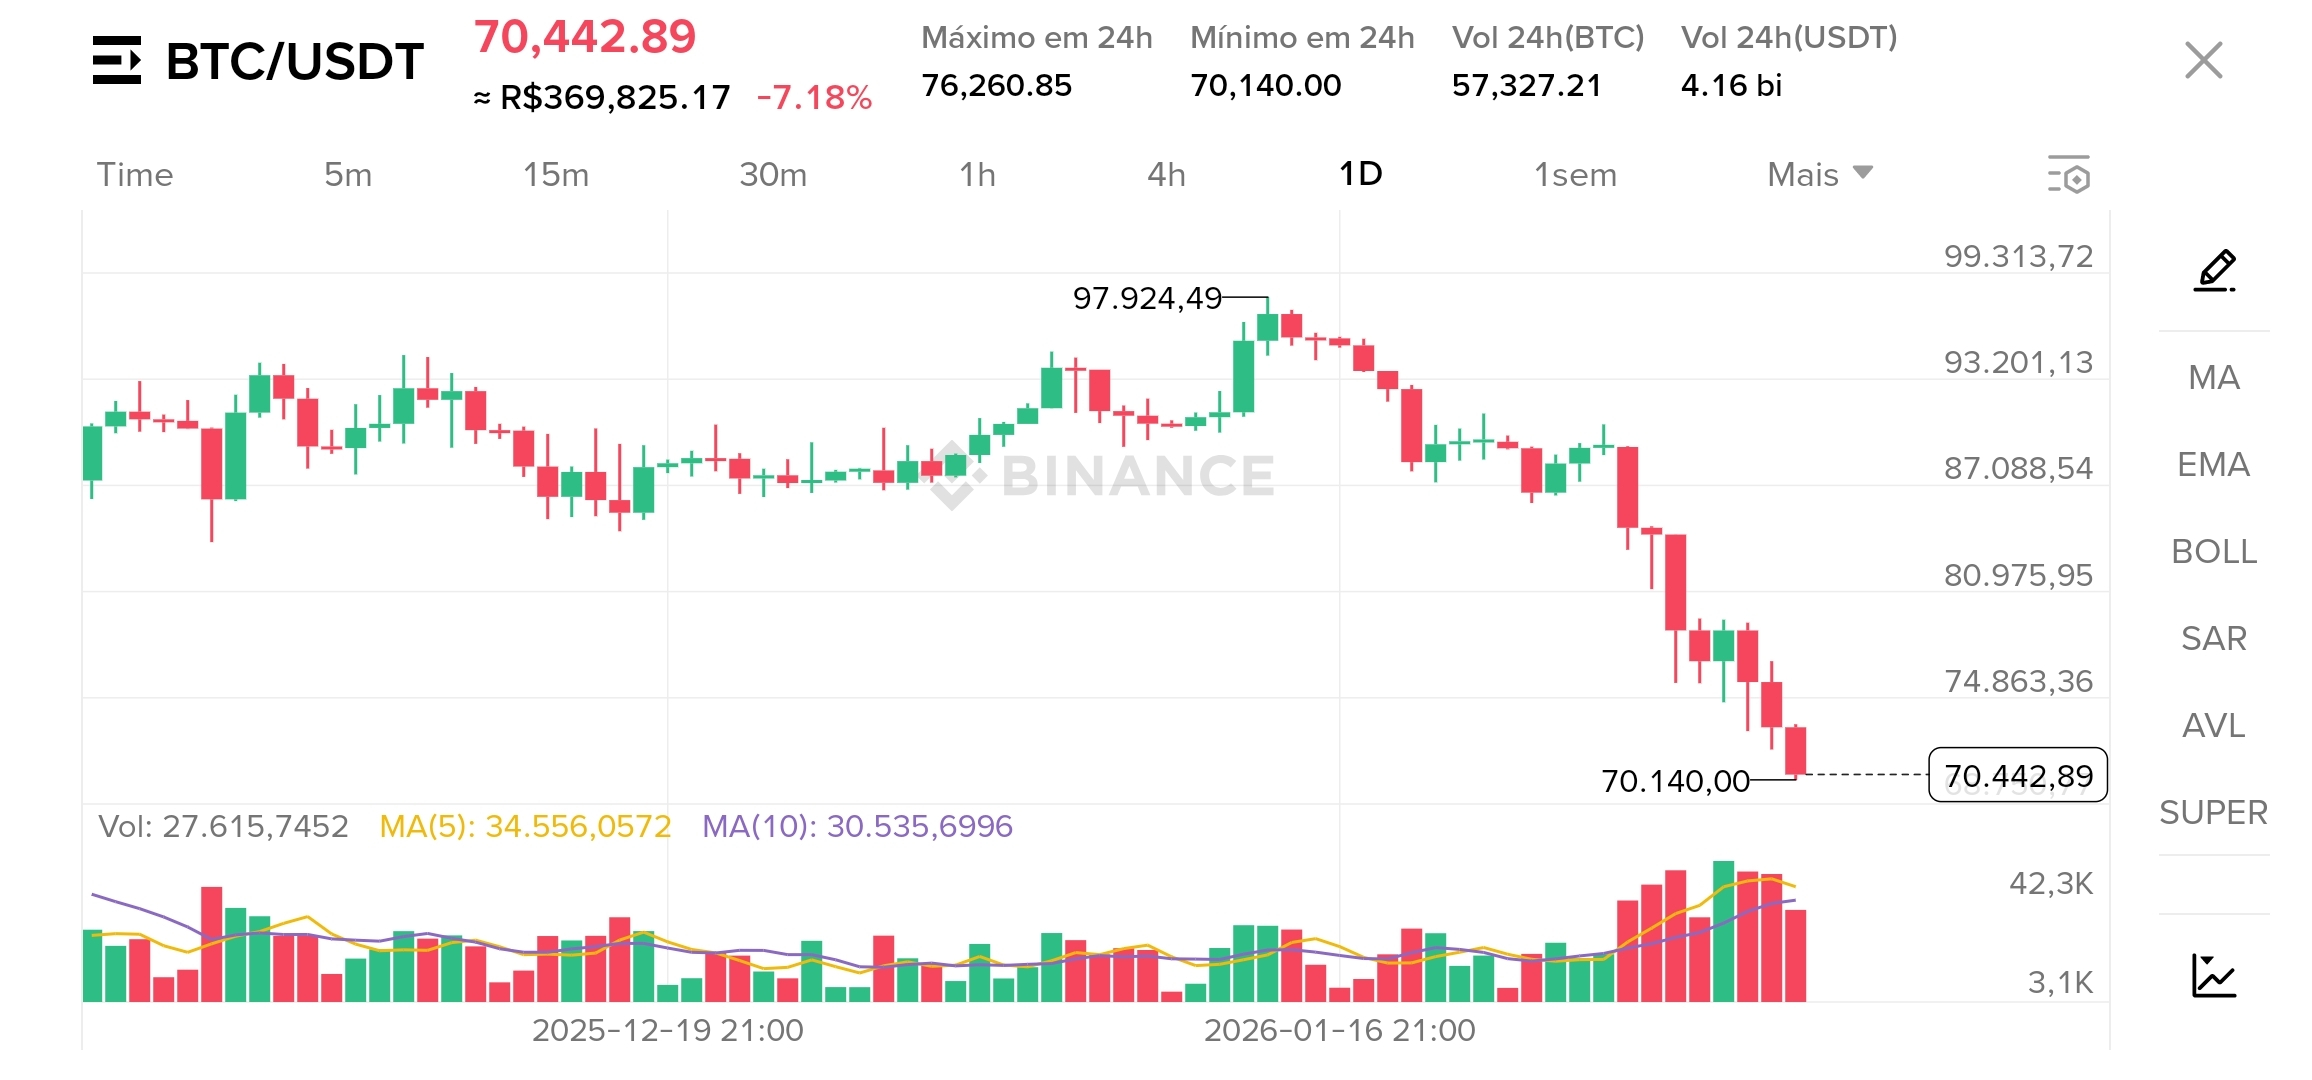
The price of BTC/USDT has undergone a correction of -7.18% in the last 24h, nearing the support of 70,140.00. The significant volume (4.16 billion in USDT) indicates strong participation, possibly signaling selling exhaustion.
Key indicators:
- The price is testing the lower limit of the Bollinger Band (around 70,140), which suggests an oversold condition.
- The listed levels (74.86336, 80.97595, 87.08854, etc.) seem to be progressive resistances in case of recovery.
- The Parabolic SAR (adjusted to the current timeframe) may be close to a reversal to bullish if the price recovers.
- The moving averages (MA(5) and MA(10)) show disparate values (around 30k–34k), which may indicate they are in another timeframe or asset; therefore, I do not consider them for this analysis.
Recommended strategy:
- Action: Buy at the current level (70.442,89) or upon confirmation of a reversal (e.g., closing of a candle above 70.500).
- Stop loss: Place below the 24h support, at 69.900, to protect against a breakdown.
- Gain targets:
1. Target 1: 74.863 (first significant resistance).
2. Target 2: 80.976 (second resistance, if the momentum holds).
- Expected gain timeframe: Short to medium term (hours to days), depending on the speed of recovery.
Risks to monitor:
- If the price breaks the support at 70.140, it may fall to lower levels (e.g., 68.000). The stop loss is essential.
- High volatility requires position management (e.g., allocating only a portion of the capital).
Conclusion: The current correction has created a buying opportunity at a strong technical support level, with good potential return against risk. However, it is important to wait for a confirmation of reversal and use stop loss to mitigate losses.
$BTC #BTC #StrategyBTCPurchase #ClawdbotSaysNoToken #TokenizedSilverSurge #TSLALinkedPerpsOnBinance