Introduction: The 'roller coaster' market and the macro logic transformation at the beginning of 2026
At the beginning of 2026, the global silver market underwent the most extreme fluctuations in history. After a 150% increase throughout 2025, silver entered a crazy 'price discovery' phase in January 2026, reaching a historic peak of $120.565 per ounce at the end of January. However, what followed was an epic crash known as 'Black Friday,' where silver prices plunged over 31% in a single day on January 30, falling to $78.53.
As of February 4, 2026, the market has shown strong bottom pattern characteristics. After reaching a phase low of $71.40, silver is experiencing a dramatic technical rebound. This volatility is not only a game of speculative funds but also profoundly reflects the changes in the leadership of the Federal Reserve, the escalation of military conflicts in the Middle East, and the structural reshaping of silver's strategic position by artificial intelligence (AI) and green energy.
Chapter 1 Real-time market dynamics review (as of February 4, 2026)
1.1 From the peak of $120 to the crash on 'Black Friday'
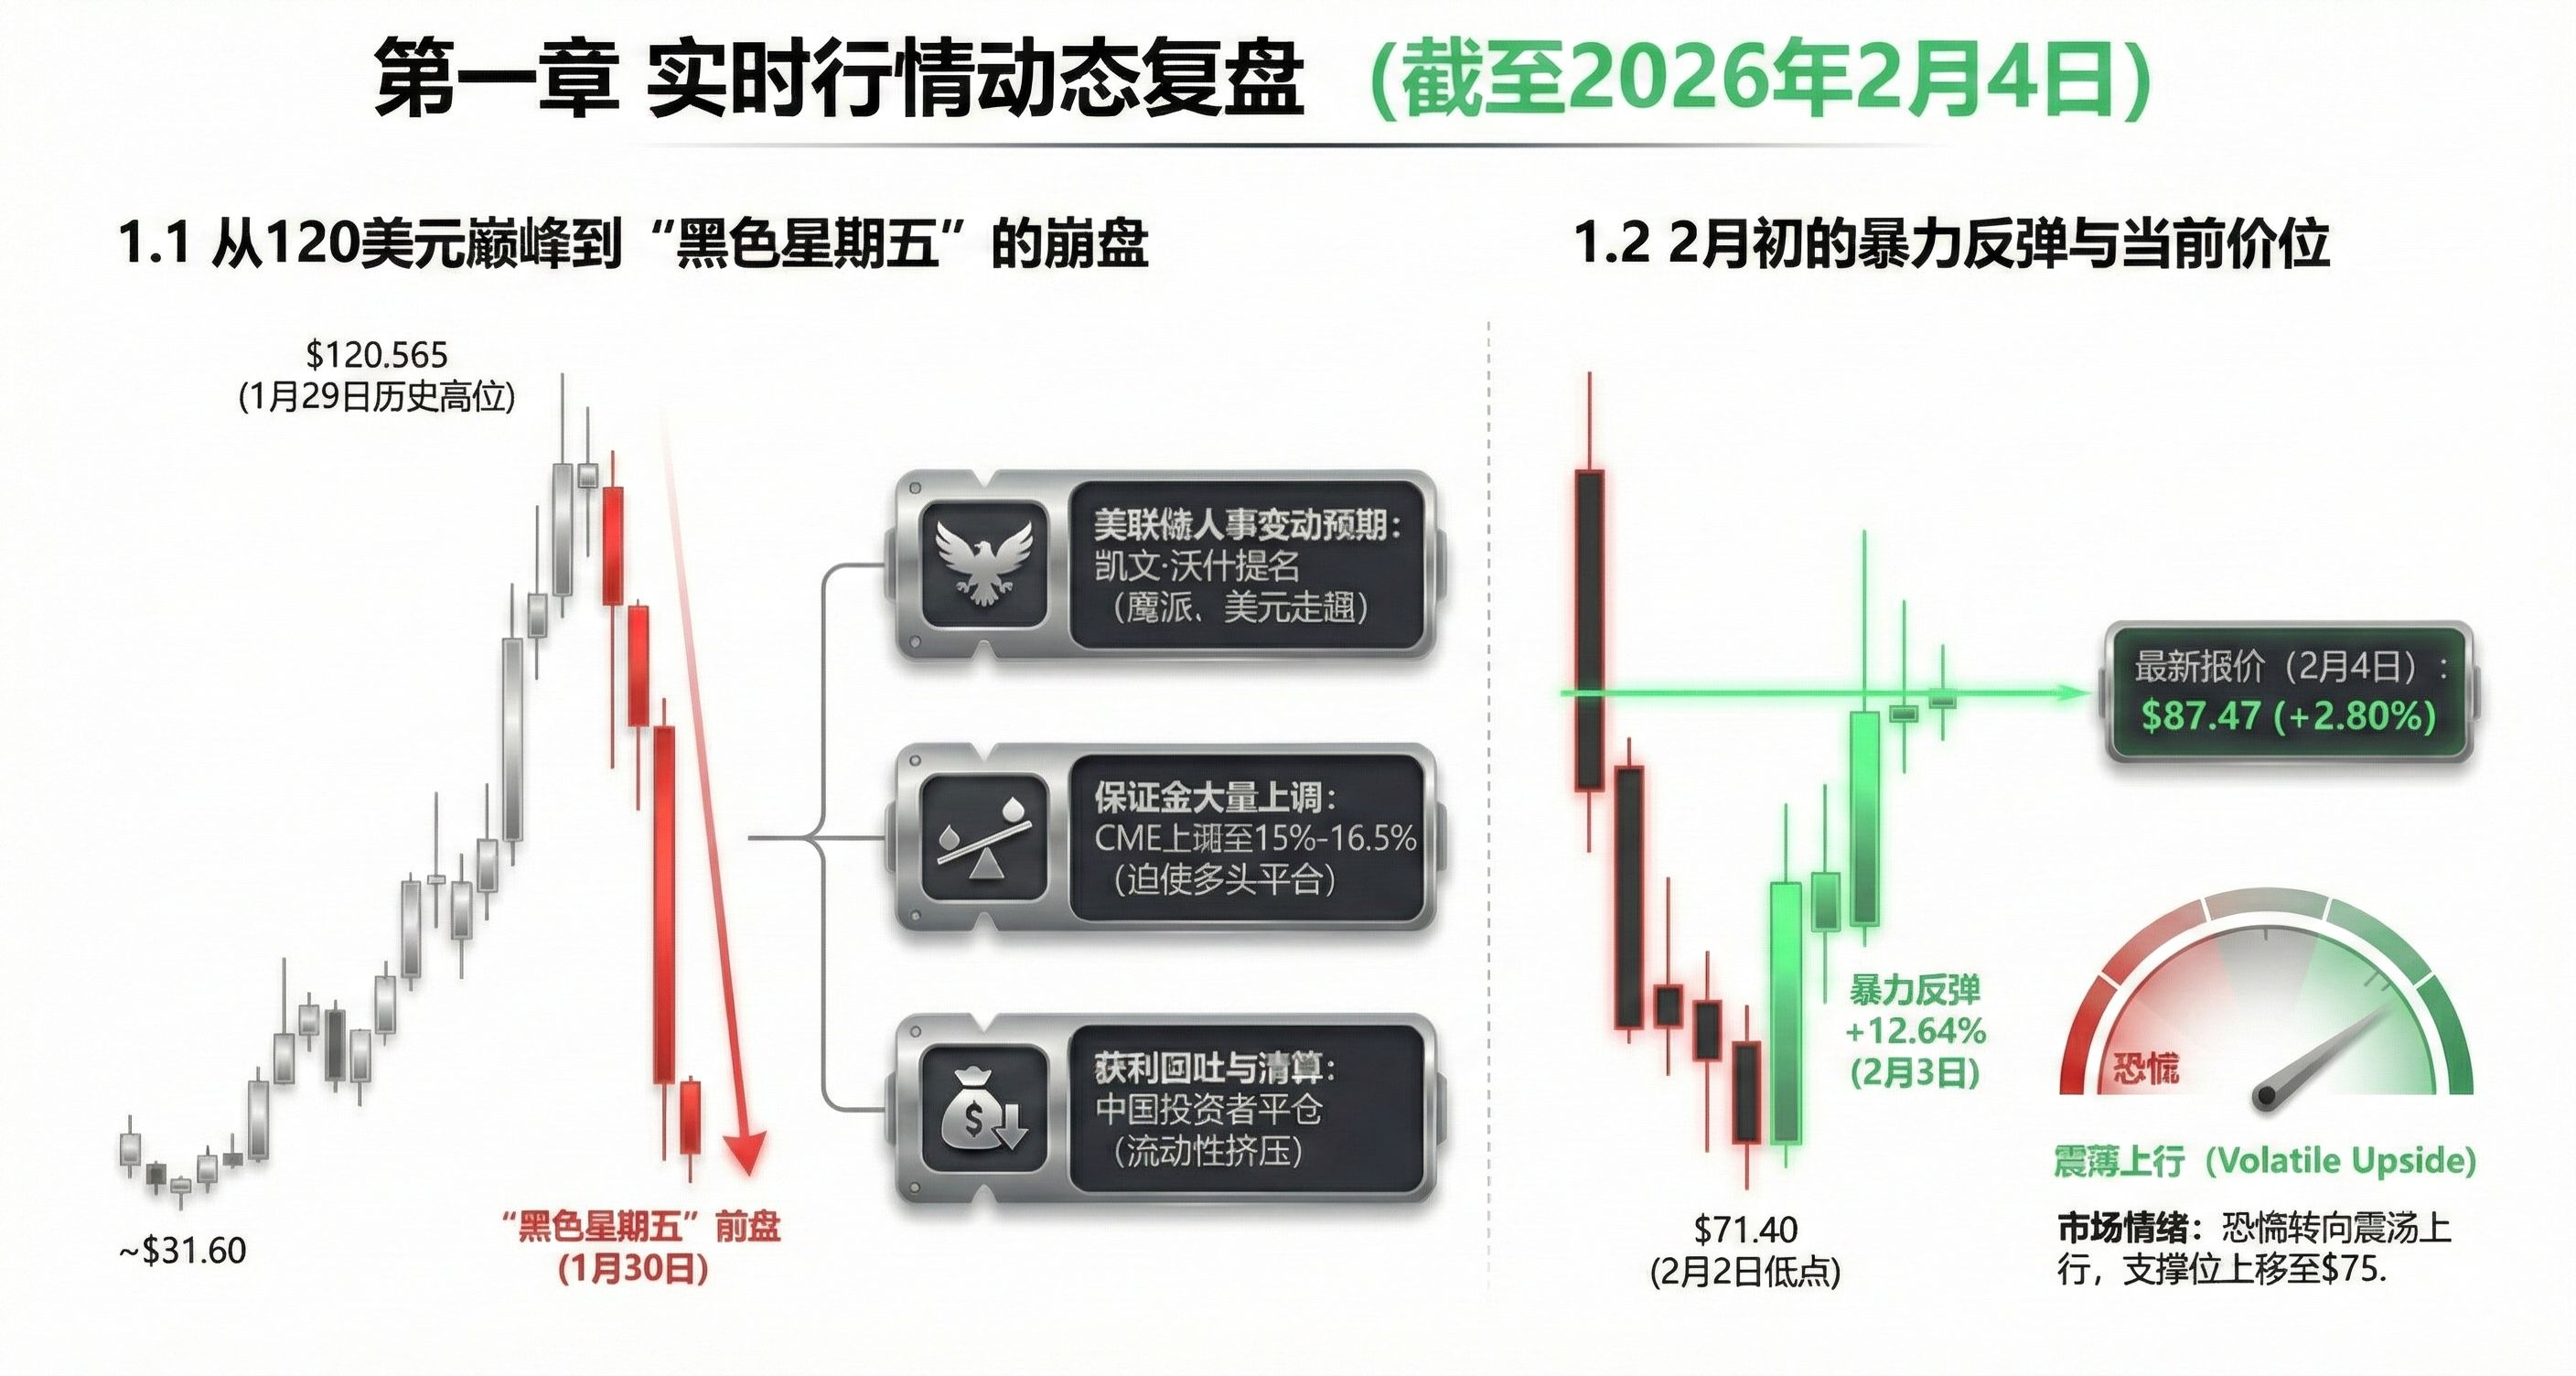
January 2026 is the 'carnival month' for silver, with prices soaring from $31.60 at the beginning of the month to a historical high of $120.565 on January 29. However, on January 30, the most severe single-day drop since 1980 occurred, mainly due to:
Federal Reserve personnel changes expectations: Trump nominates the hawkish Kevin Warsh to replace the Federal Reserve Chairman. The market quickly prices in a longer-term tightening monetary environment, leading to a stronger dollar.
Margin significantly increased: CME Group raised the silver futures margin from 11% to 15% (with high-risk categories raised to 16.5%), forcing leveraged bulls to collectively liquidate.
Profit-taking and liquidation: Previously profitable Chinese investors began to liquidate on a large scale, triggering a chain of liquidity squeezes.
1.2 The violent rebound in early February and the current price level
Entering February, silver did not collapse as bears expected. After hitting a low of $71.40 on February 2, silver recorded a 12.64% single-day increase on February 3 due to industrial buyers and bottom-fishing funds entering, returning above $86.
📈Latest quote (February 4): The silver price is currently fluctuating around $87.47/ounce, up 2.80% from the previous day.
⌛️Market sentiment: Despite high volatility, the market has shifted from panic selling to a fluctuating upward trend, with major support levels moving up to the $75 range.
Chapter 2 Macroeconomic and geopolitical driving factors
2.1 The 'powder keg' of geopolitical conflicts
The geopolitical crisis in early 2026 injected a strong safe-haven premium into silver:
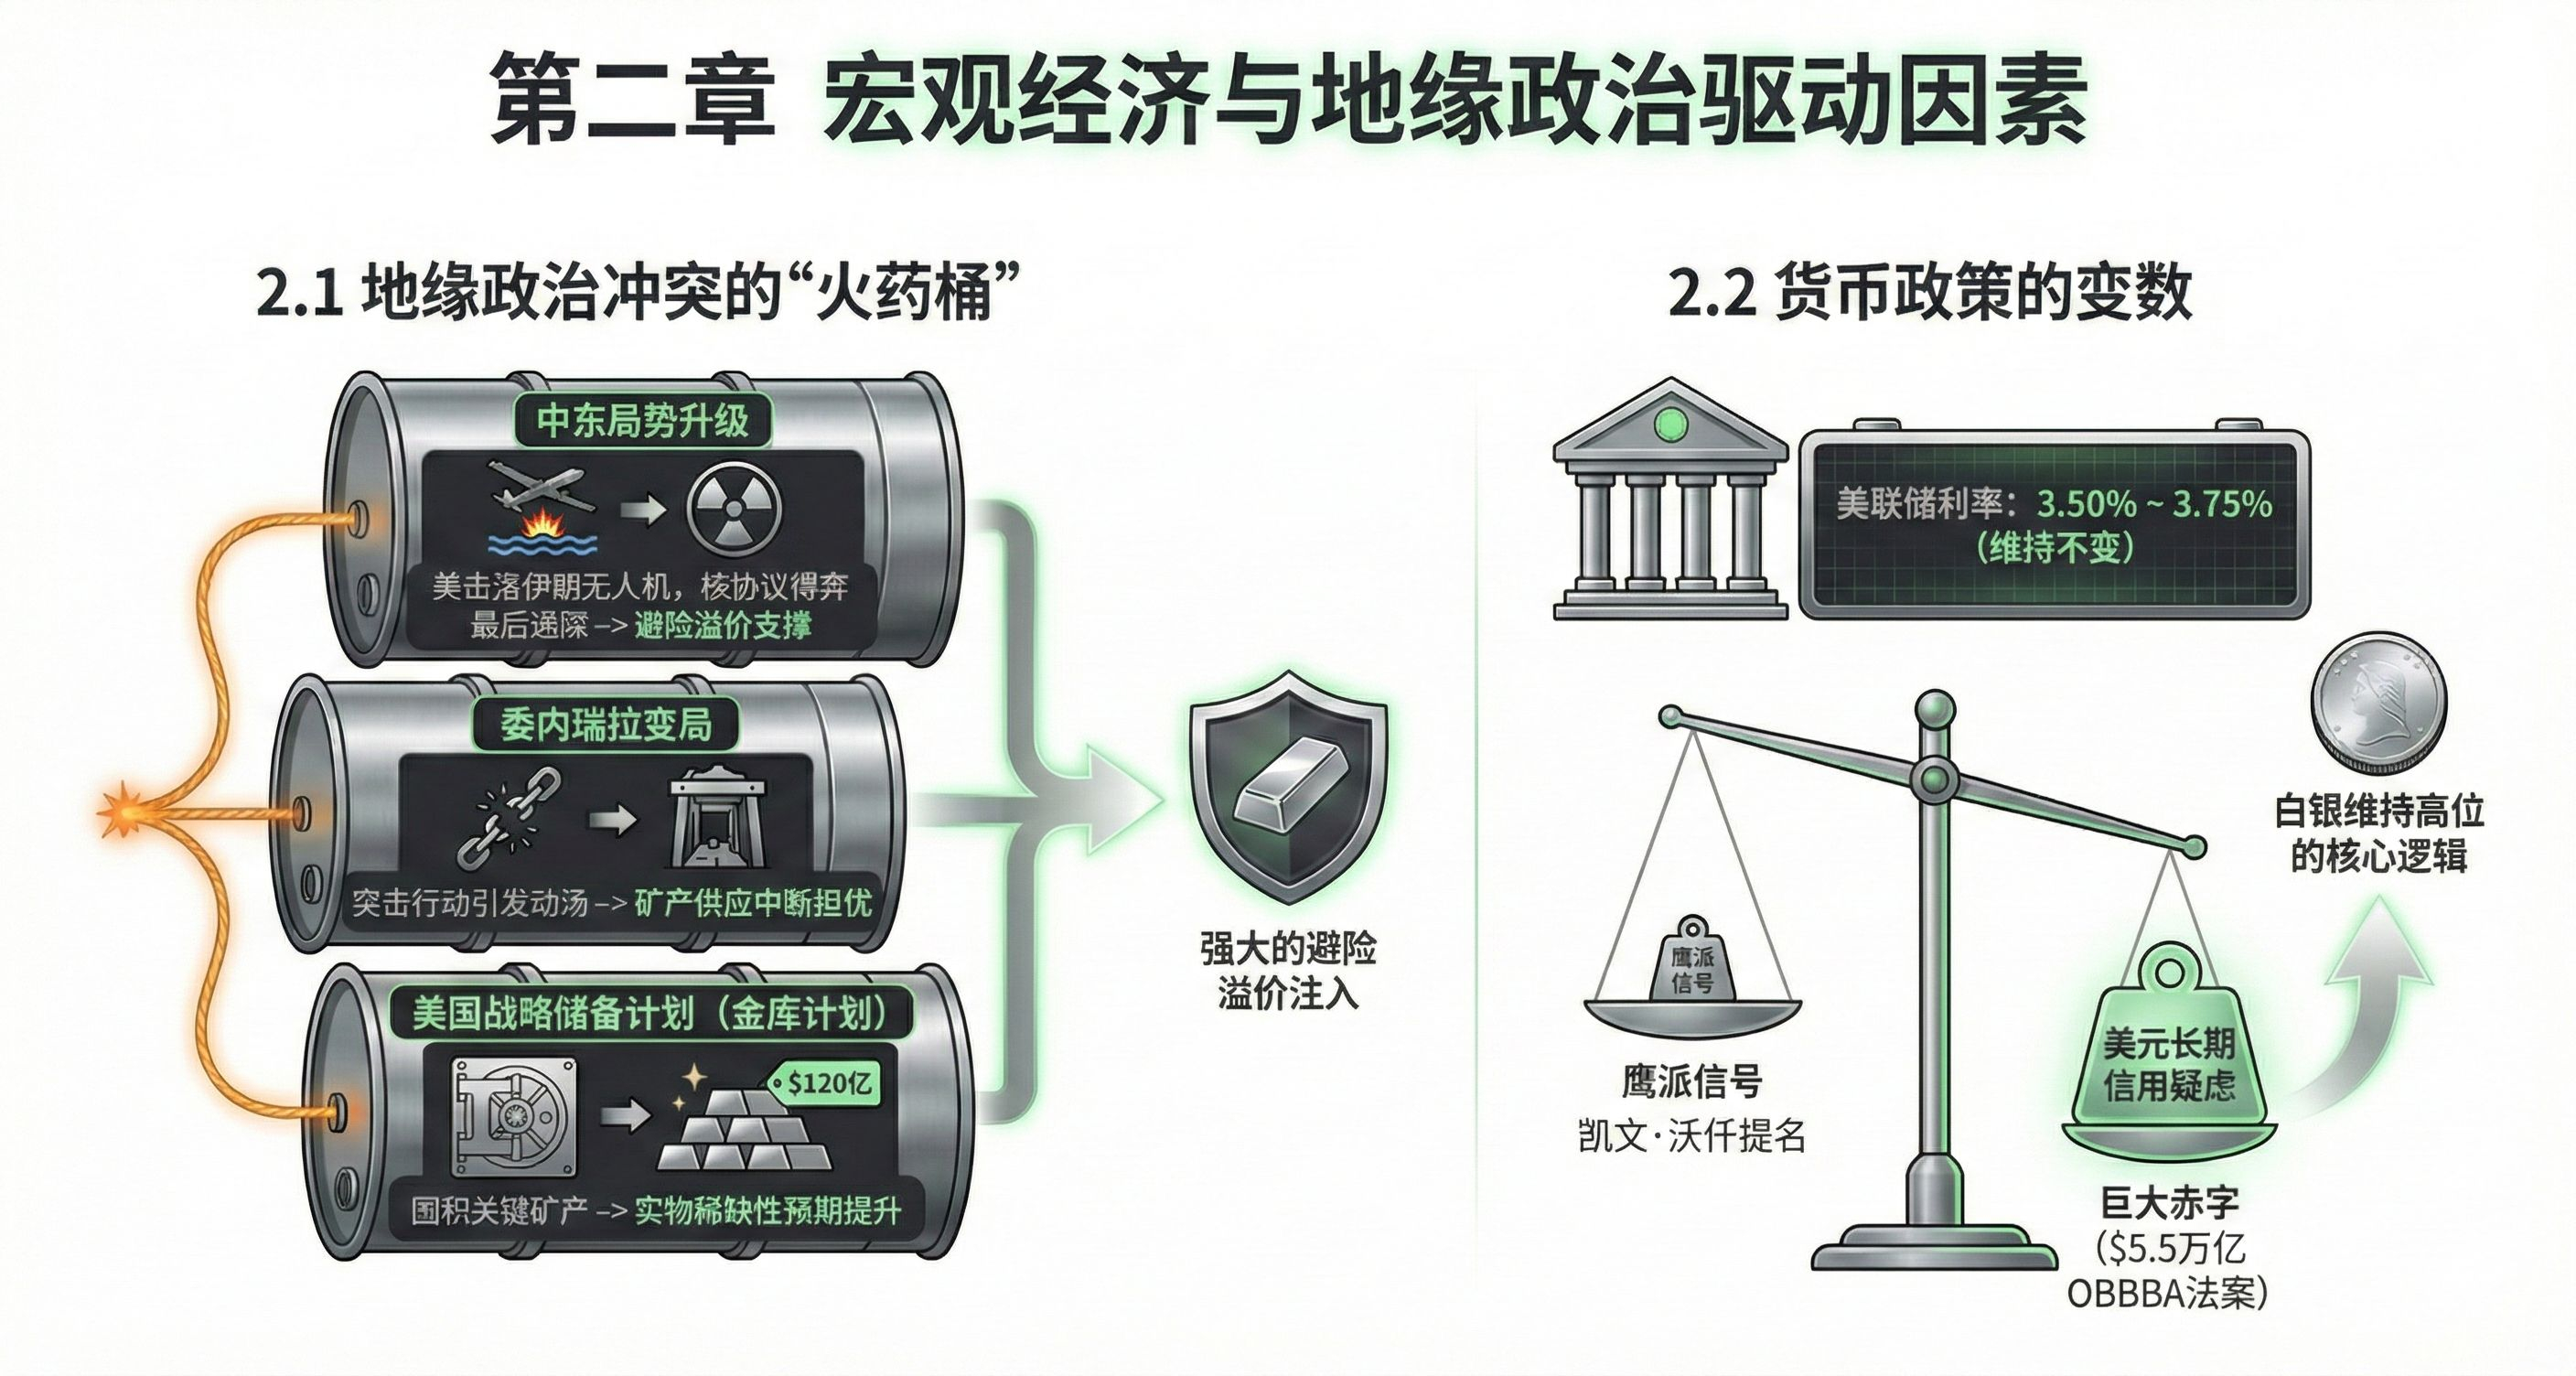
▶️ Middle East situation escalates: On February 4, the U.S. Navy shot down an Iranian drone in the Arabian Sea. Meanwhile, the game between Iran and the U.S. regarding the nuclear agreement has entered the final ultimatum stage, supporting crude oil and safe-haven metal prices.
▶️ Venezuela situation: On January 3, the U.S. launched a surprise action against Venezuelan leaders, and the subsequent turmoil raised concerns about disruptions in Latin American mineral supplies.
▶️ U.S. strategic reserve plan: The Trump administration launched a strategic metal reserve called 'Project Vault', investing $12 billion to stockpile key minerals, including rare metals, enhancing market expectations for the scarcity of physical metals.
2.2 Variables in monetary policy
The Federal Reserve maintained interest rates at $3.50% \sim 3.75%$ during the meeting on January 28. Although Kevin Warsh's nomination is seen as a hawkish signal, concerns about the long-term credit of the dollar remain the core logic for silver to maintain high levels due to the massive U.S. deficit (influenced by the $5.5 trillion OBBBA Act in 2025).
Chapter 3 Industrial demand: AI revolution and physical bottlenecks in energy transition
3.1 The cornerstone of AI hardware for conductivity and heat dissipation
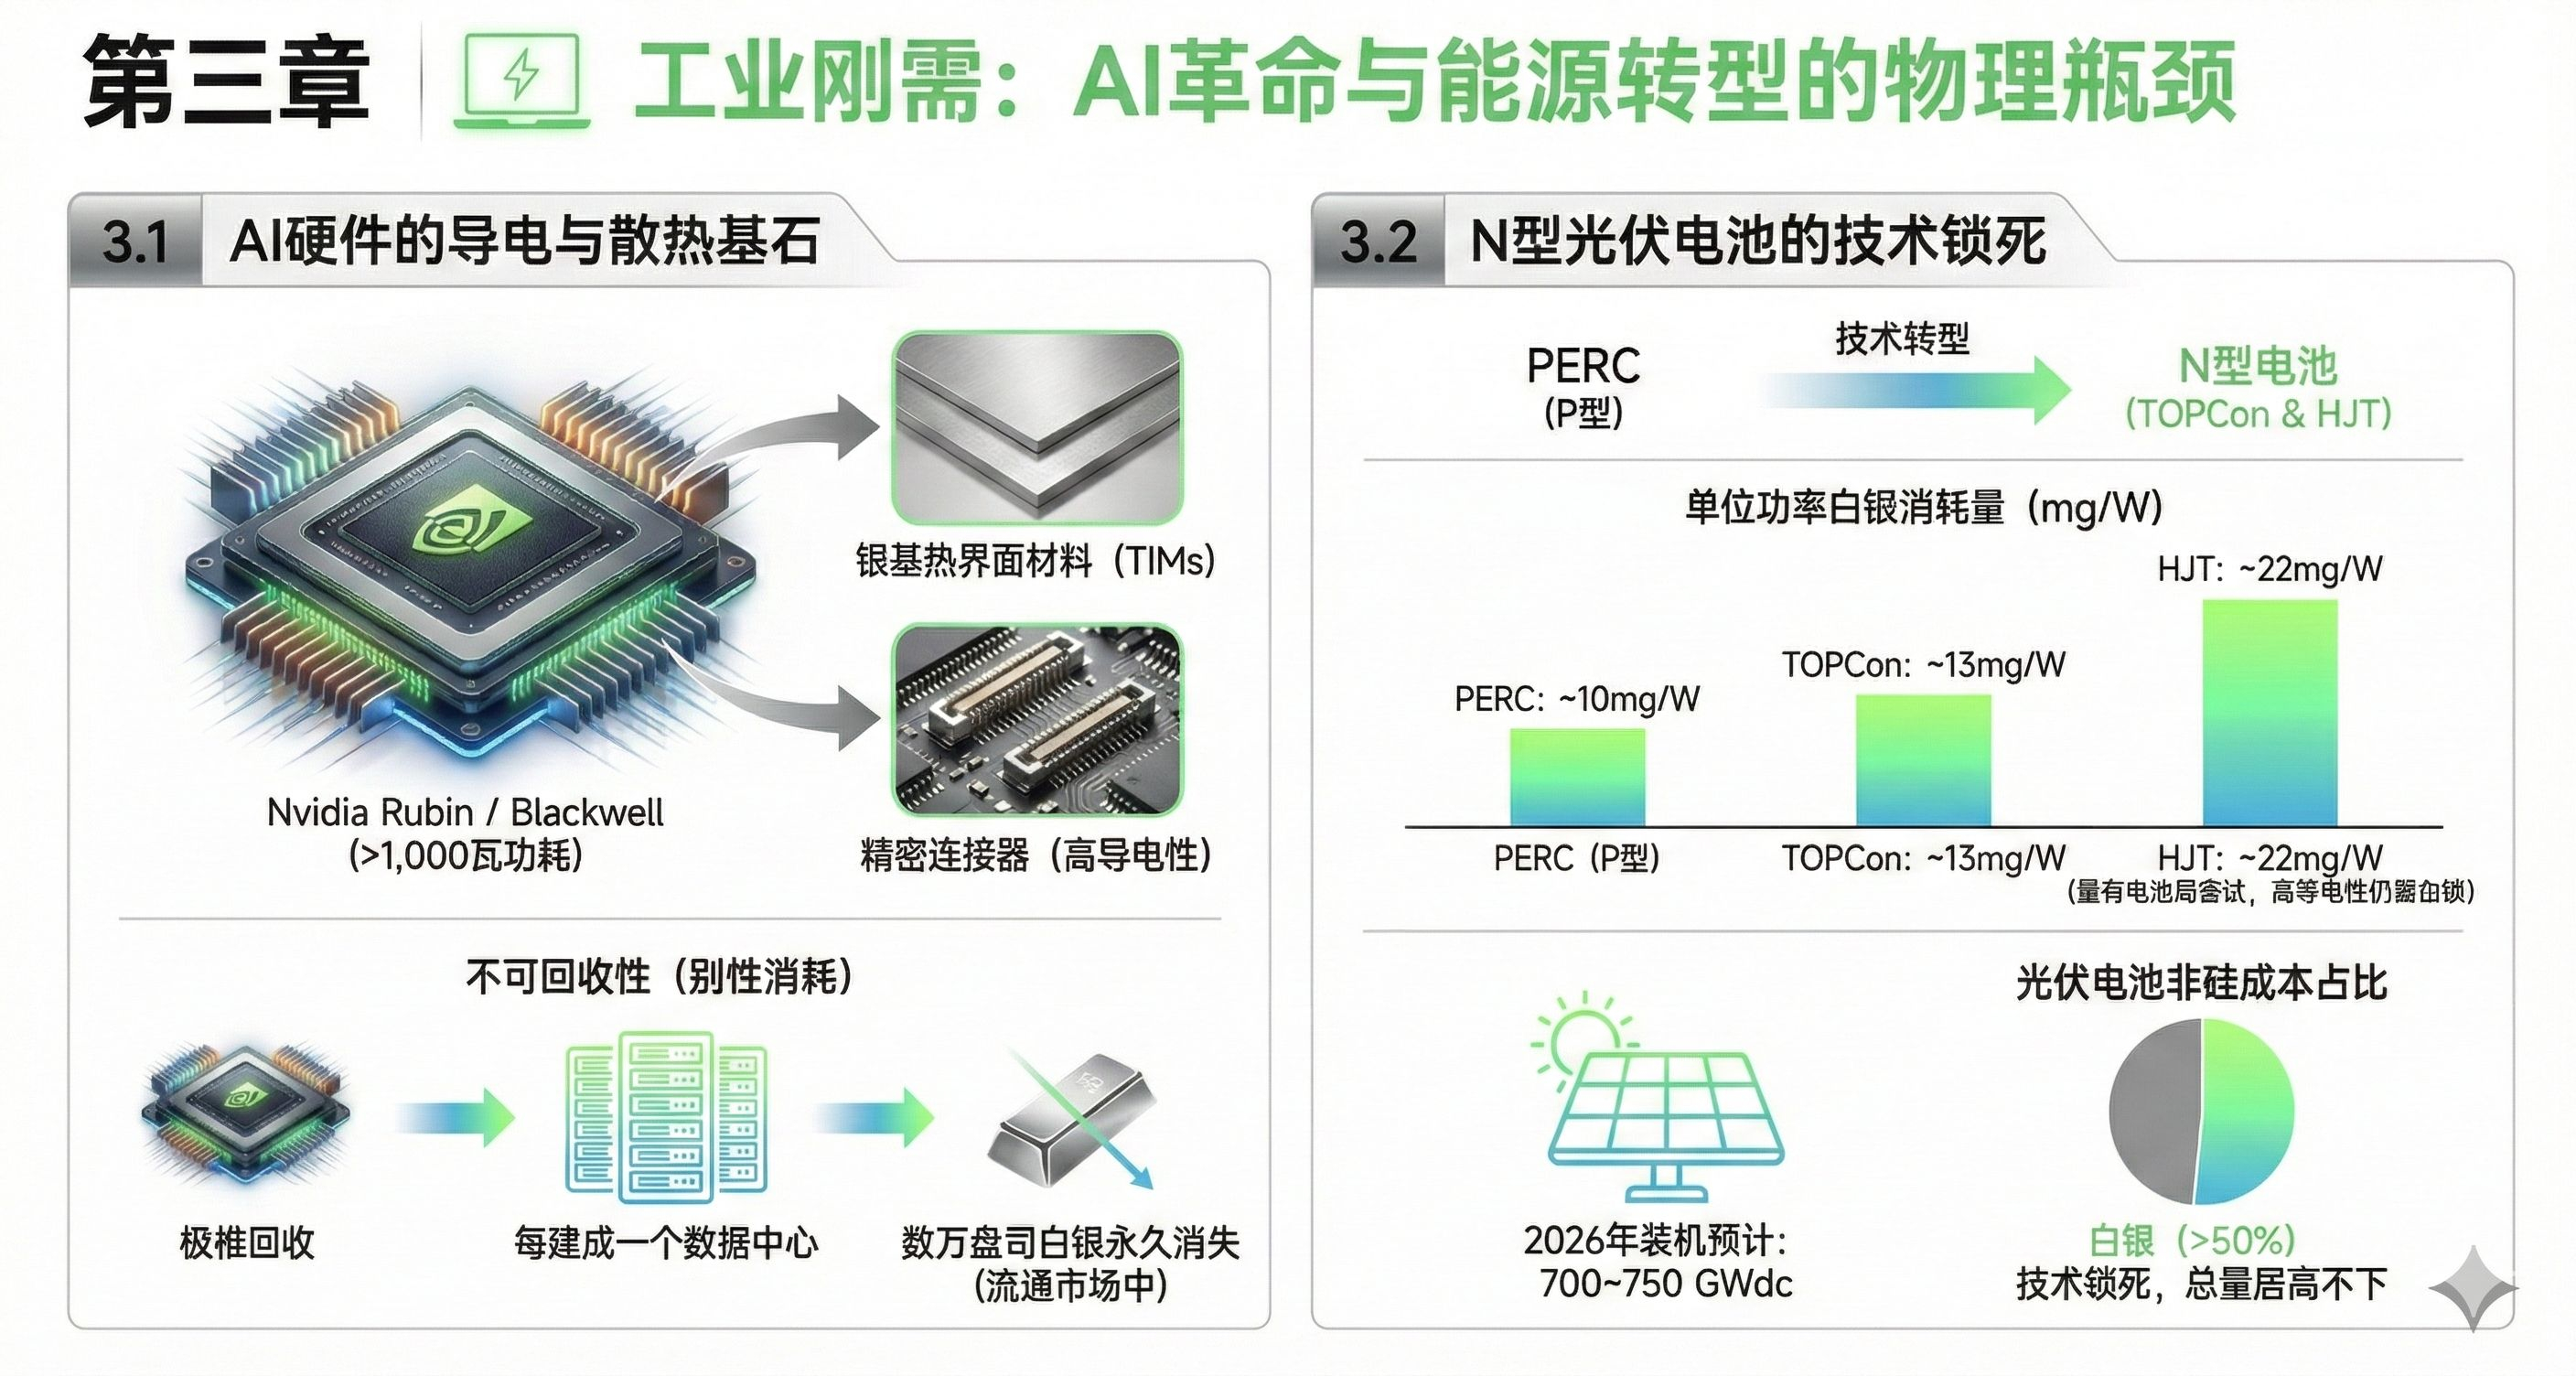
2026 is the year of large-scale construction of AI infrastructure. High-performance chips like Nvidia's Rubin and Blackwell have power consumption exceeding 1,000 watts, leading to unprecedented demand for silver-based thermal interface materials (TIMs) and precision connectors.
Irrecoverability: Silver in AI chips is extremely difficult to recycle. This 'rigid consumption' means that for every data center built, tens of thousands of ounces of silver will permanently disappear from the circulating market.
3.2 The technological lock-in of N-type photovoltaic cells
The photovoltaic industry is in the final stage of transitioning from PERC to N-type batteries (TOPCon and HJT), significantly increasing the silver consumption per unit of power.
1⃣Consumption intensity comparison:
PERC: About $10\text{mg/W}$.
TOPCon: About $13\text{mg/W}$.
HJT: About $22\text{mg/W}$ (although there have been attempts to replace silver with copper, the demand for high conductivity still keeps the total amount of silver high).
2⃣Market share: The installed capacity of photovoltaics is expected to reach $700 \sim 750\text{GWdc}$ in 2026, and silver's share of the non-silicon cost in photovoltaic cells has exceeded 50%.
Chapter 4 Structural shortages on the supply side and exchange inventory crisis
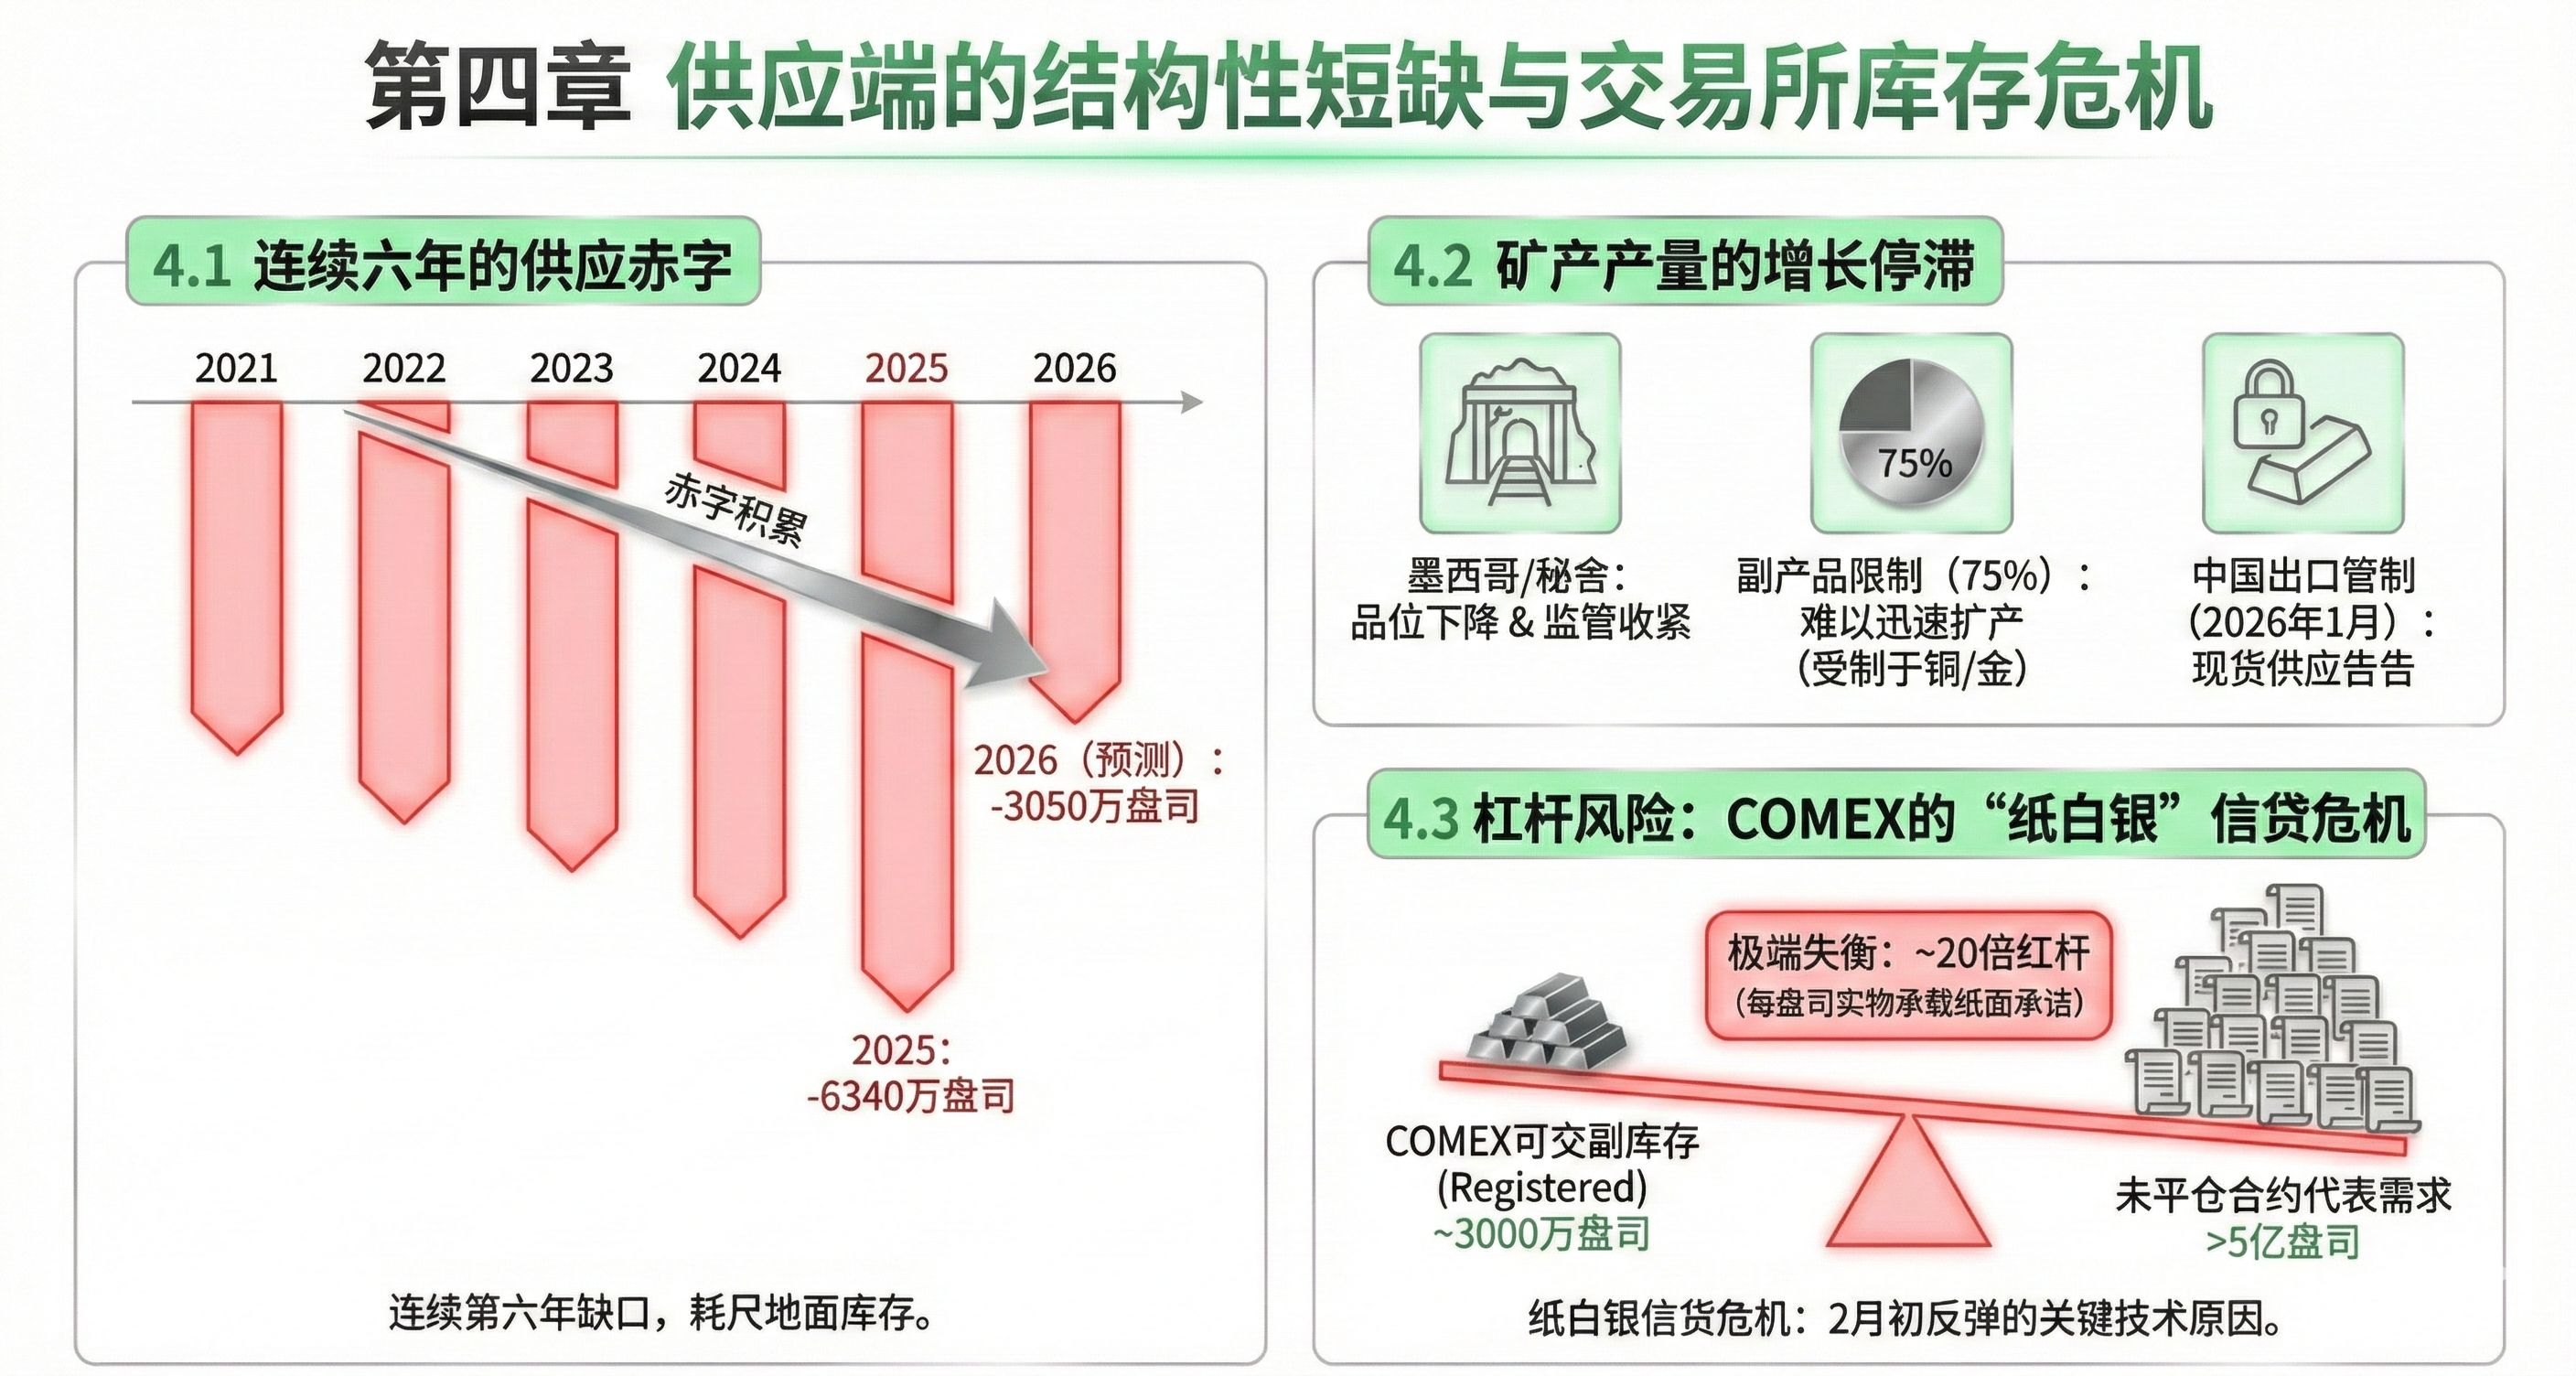
4.1 Continuous six-year supply deficit
Metal Focus predicts that 2026 will mark the sixth consecutive year of global silver supply deficits. Although the deficit is expected to narrow from 63.4 million ounces in 2025 to 30.5 million ounces, the years of accumulated physical deficits have exhausted ground inventories.
4.2 The stagnation of mineral production growth
Major silver-producing countries (Mexico, Peru) are facing declining grades and tightening regulations.
By-product restriction: 75% of silver is produced as a by-product of copper and gold mines. Therefore, even if the silver price is above $80, it is difficult for mines to quickly expand production due to the price increase of a single metal.
China's export controls: Starting from January 2026, China further tightens the export quotas for refined silver, directly leading to a supply shortage in the international spot market.
4.3 Leverage risk: COMEX's 'paper silver' credit crisis
Data from mid-January shows that COMEX's deliverable inventory (Registered) has fallen to about 30 million ounces, while the delivery demand represented by open contracts exceeds 500 million ounces. Each ounce of physical silver carries about 20 times the 'paper commitment', and this extreme imbalance is the key technical reason for the rapid rebound in prices after the sharp decline in early February.
Chapter 5 Future trend forecasts and valuation logic
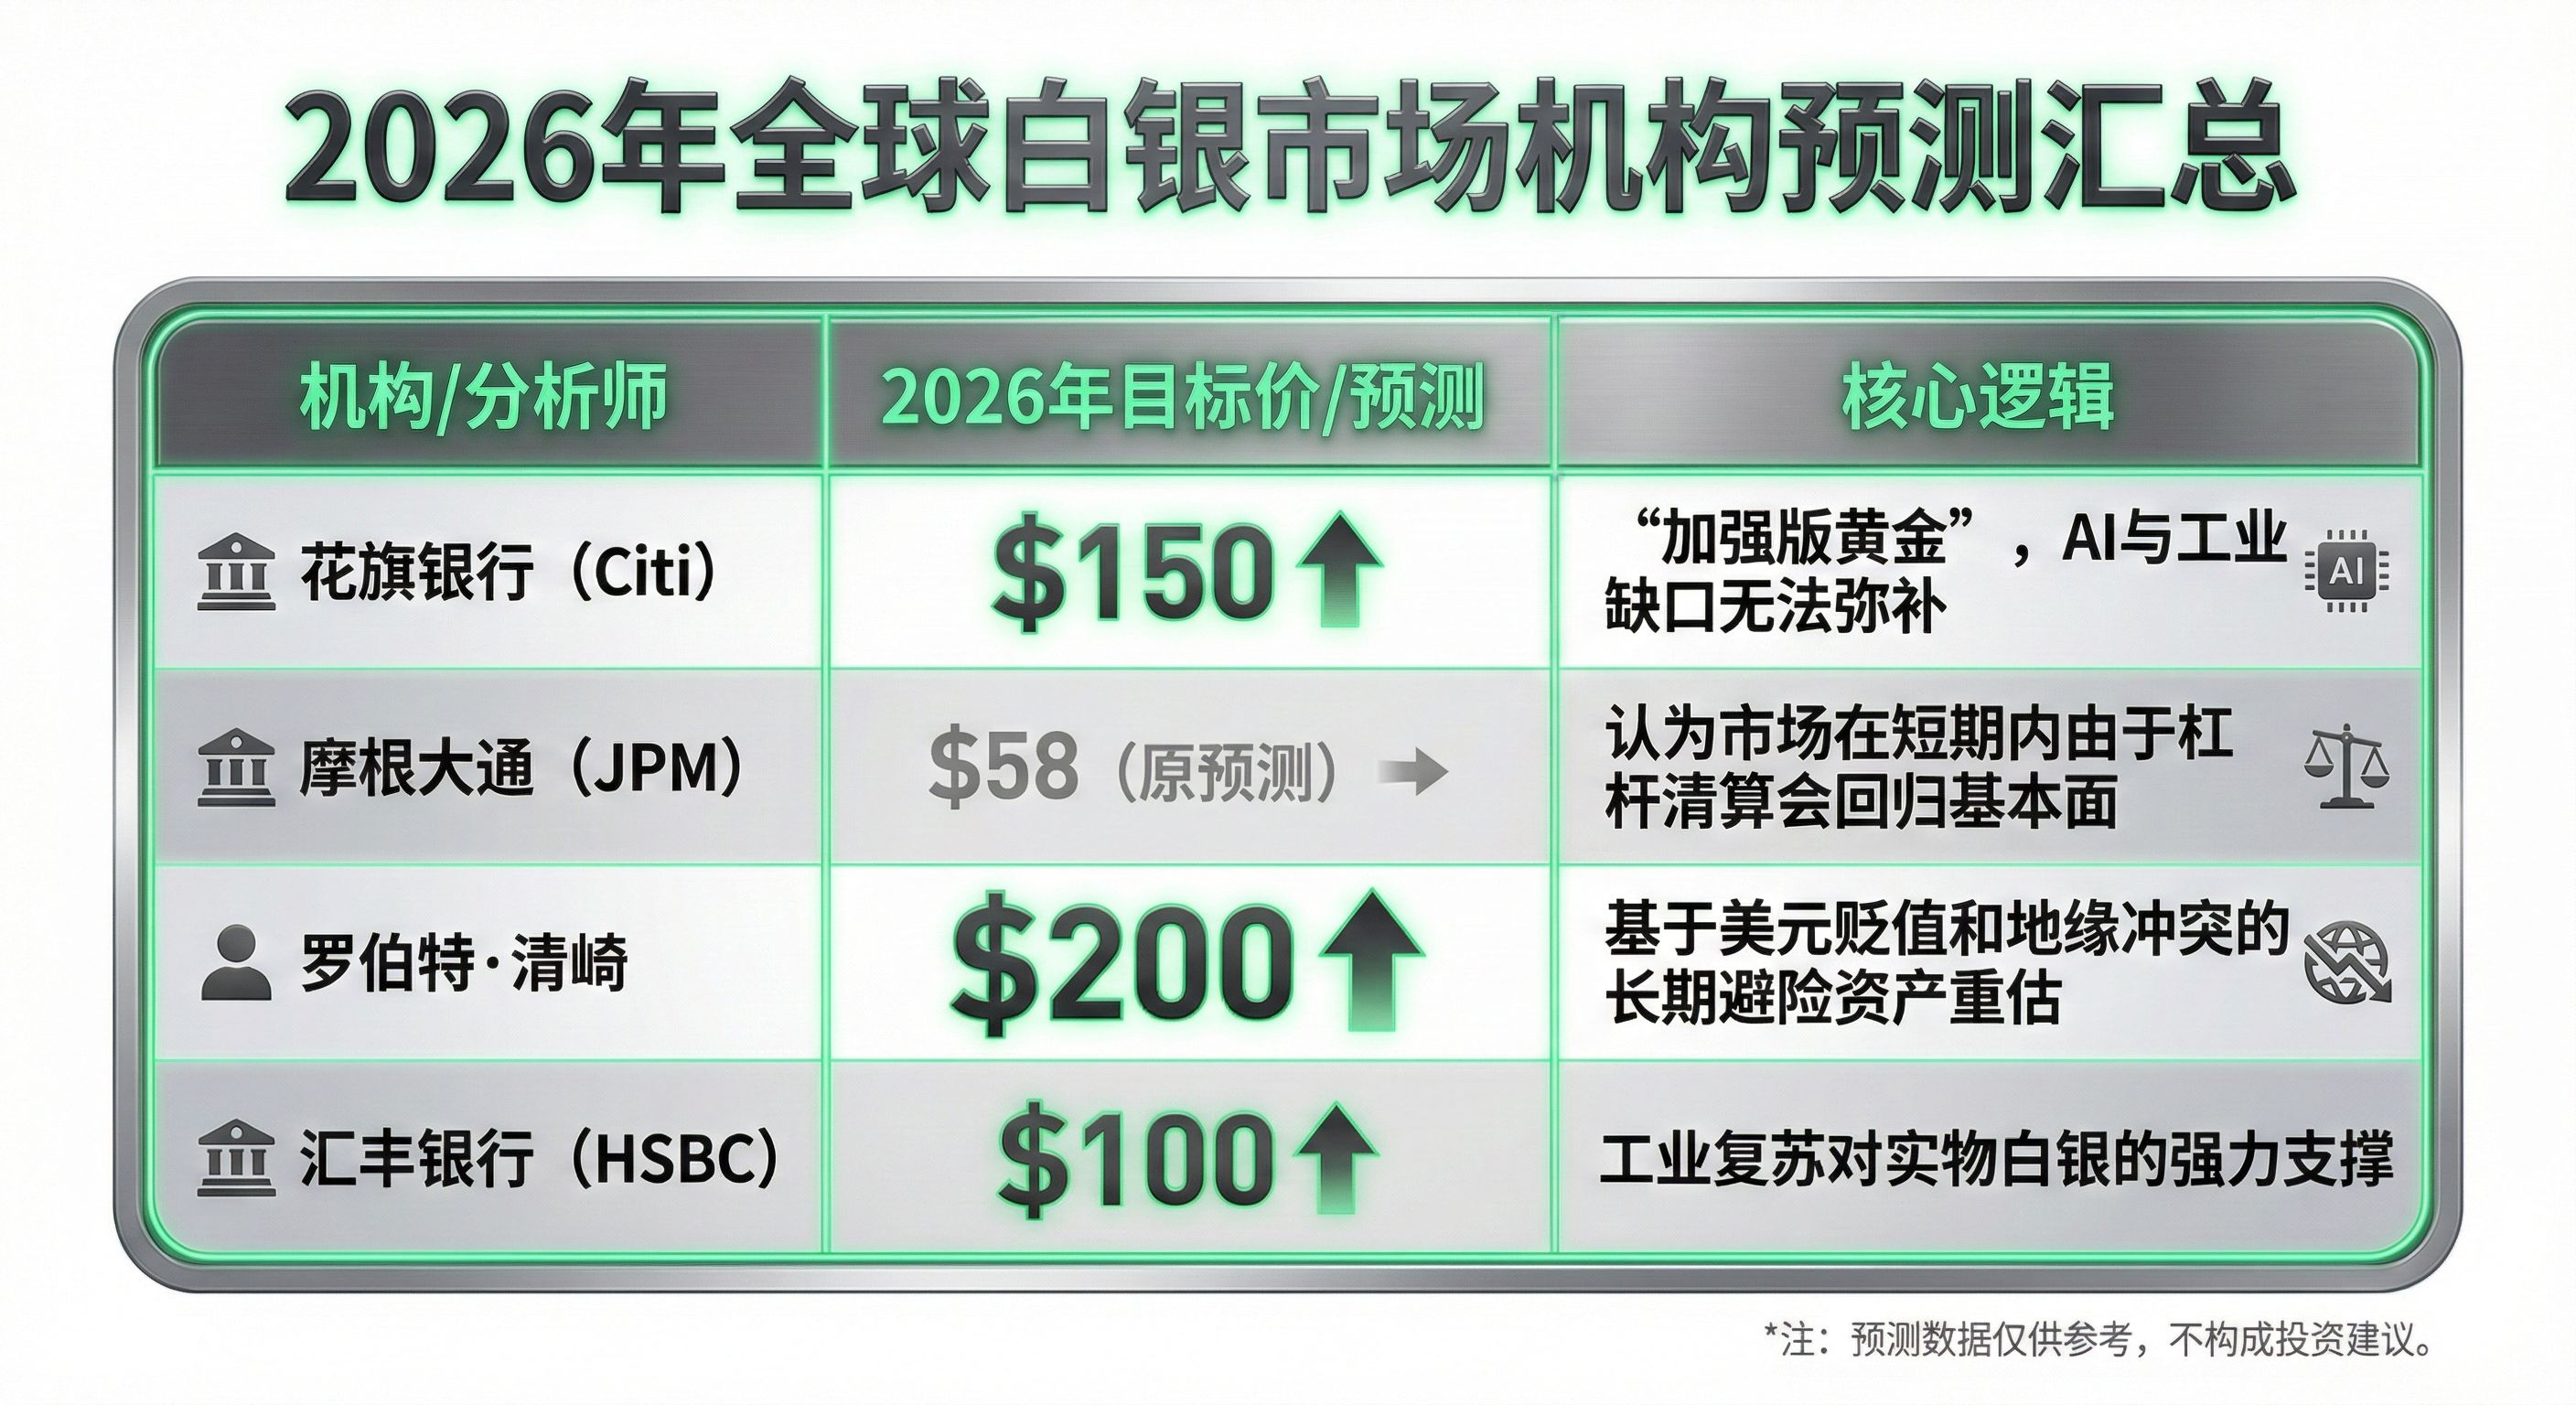
5.1 Institutional valuation perspectives
5.2 The contraction of the gold-silver ratio
Currently, the gold-silver ratio has compressed from above 100 times in 2025 to about $64:1$ (January 27 data) or even lower. Historically, at the peak of the silver bull market, this ratio often backtested $32:1$. If gold remains above $5,000, the mathematical target price for silver will point to $150 or even higher.
Conclusion: The certainty and volatility of strategic assets coexist.
Based on the analysis of the latest data as of February 4, 2026, the following conclusions can be drawn:
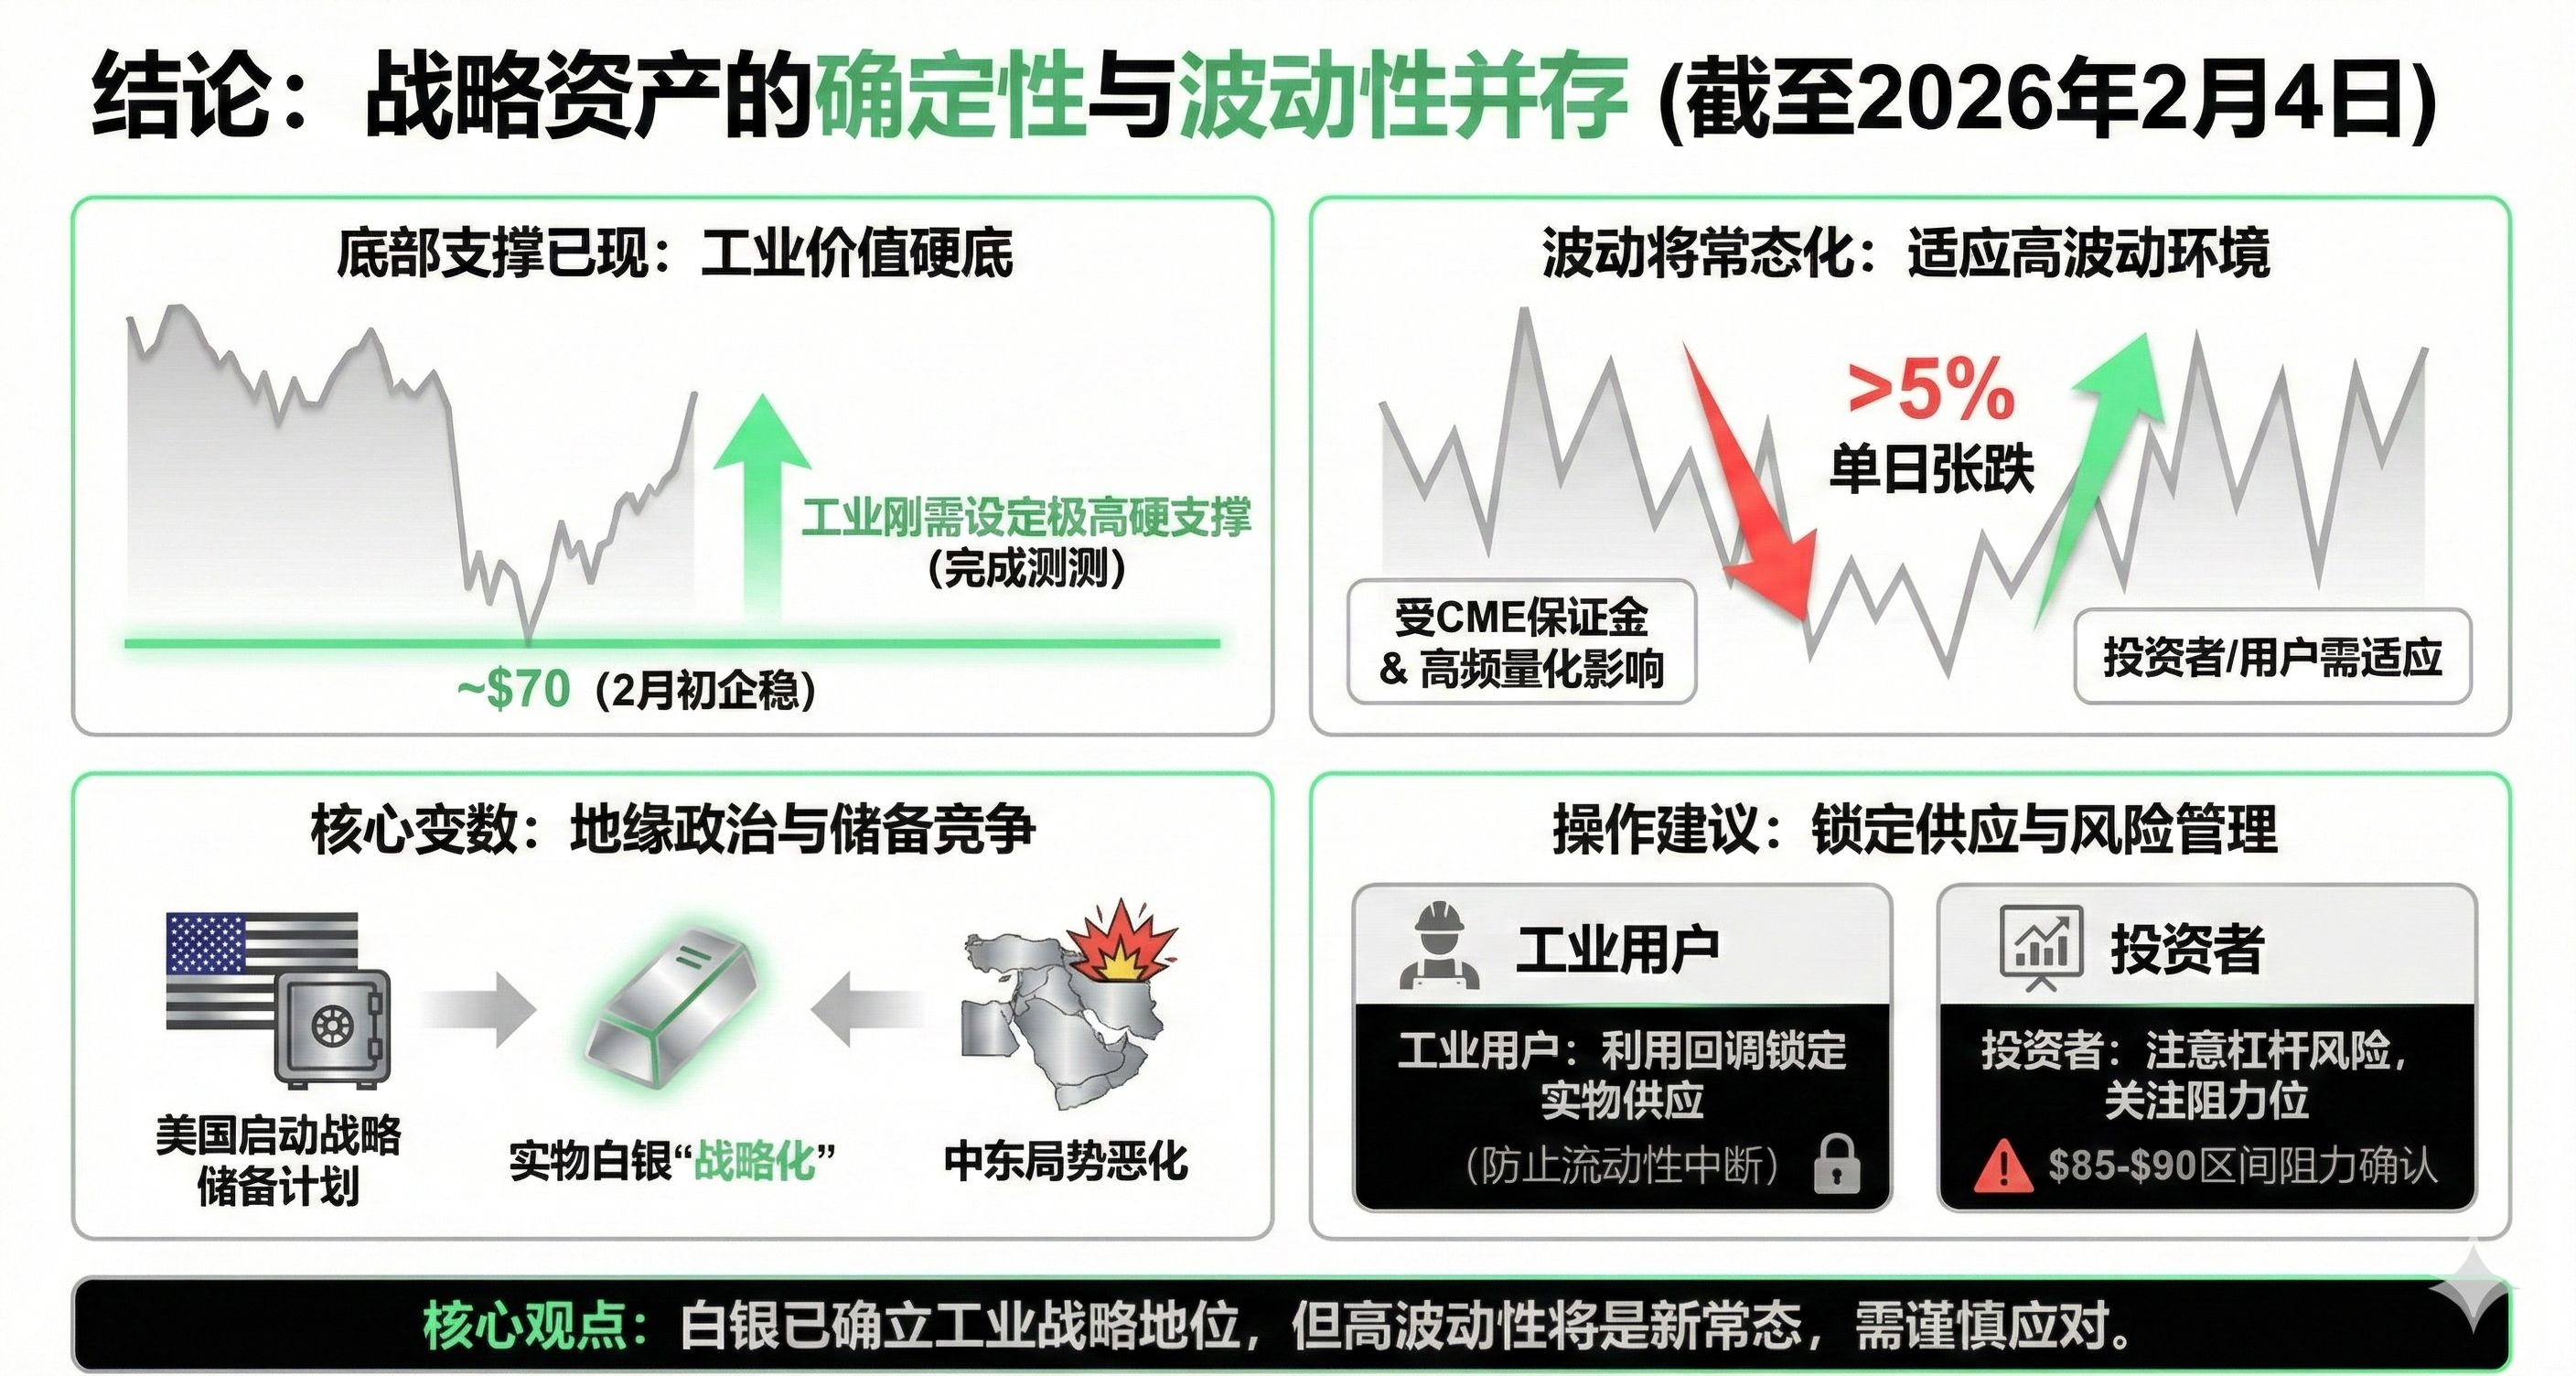
Bottom support has appeared: The rapid stabilization of prices around $70 in early February indicates that silver has completed the backtest from speculative frenzy to the industrial value bottom. Industrial demand sets a very high hard support for silver prices.
Volatility will normalize: Due to CME margin requirements and high-frequency quantitative trading, daily fluctuations in silver of more than 5% will become frequent. Investors and industrial users must adapt to this high-volatility environment.
Geopolitics and reserve competition are core variables: As the U.S. initiates its strategic reserve plan and the situation in the Middle East deteriorates, the 'strategic' tendency of physical silver will become increasingly evident.
Operational advice: Industrial users should use the current pullback window to lock in physical supply to prevent future liquidity disruptions; investors need to pay attention to leverage risks and watch for resistance levels in the $85-90 range.