After eleven years of trading cryptocurrencies, my deepest realization is that the core of stable profits is not predicting the market, but building a trading system that can withstand bull and bear markets.
In the first three years, I lost 80% of my principal. The pitfalls I encountered include chasing after rising altcoins that went to zero, using 10x leverage during volatile markets and getting liquidated, and trusting rumors to buy high.
It wasn't until I established a triangular system of "trend anchoring + signal validation + risk control safety net" that I achieved five consecutive years of positive returns!
I now have 70 million in my account, all earned through hard work over the past few years. Today, I will also share my insights with everyone!

In my years of day trading, the ABCD pattern has been one of the most frequently seen and easiest to profit from technical patterns. It is not complex and does not involve a bunch of flashy indicators, but it is highly effective, with clear structure and intuitive logic, providing clear signals.
When I first entered the market, many opportunities were actually right in front of me, but I just didn’t dare to act. After truly understanding the ABCD chart pattern, the market suddenly became 'ordered': where the push was, where the pullback was, where to wait, and where to enter were all clear. Entry became not a matter of feeling, but of structure, logic, and expectation, leading to stable profits.
It is no exaggeration to say that whether you are just beginning to learn trading or have been doing it for several years, as long as you are day trading, the ABCD pattern is almost an unavoidable foundational skill. It not only helps you improve your win rate, but more importantly, it lets you know 'why you should trade here.'
Next, I will guide you to thoroughly break down this pattern—see why it works so well in day trading and how you can truly turn it into a profit tool for your account.
Successfully applying the ABCD pattern trading involves understanding market psychology
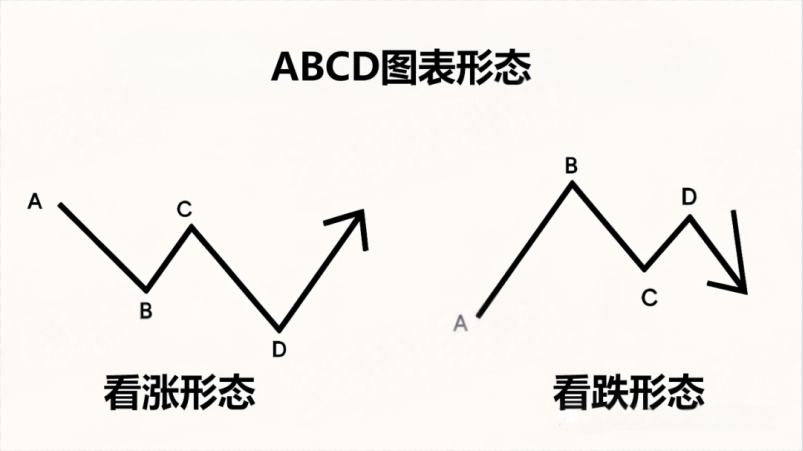
The ABCD pattern is not just a few lines on a chart; it essentially reflects human behavior in the market. By connecting the four key price points A, B, C, and D, this pattern clearly presents the fluctuations of market sentiment, demonstrating how fear and greed drive price movements. To truly utilize the ABCD pattern, understanding the underlying trading psychology is key.
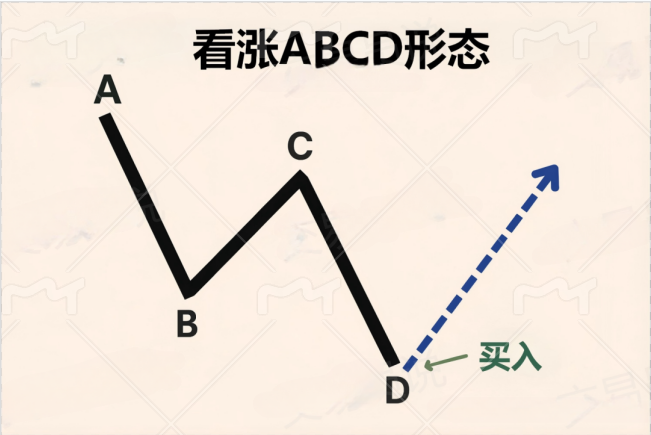
Taking the bullish ABCD pattern as an example. The first segment AB is usually a drop driven by panic and selling; the subsequent segment BC is a price correction rebound, where some buyers see an opportunity; however, this rebound often lacks confidence and quickly triggers the next drop CD; the final drop of segment CD is usually accompanied by concentrated stop-losses or capitulation selling from short sellers, marking a point where market sentiment is extremely exhausted and providing potential buying opportunities for traders anticipating a reversal.
Fear, greed, and the formation of the ABCD pattern
The true power of the ABCD pattern lies in its ability to capture changes in market psychology. Fear and greed do not appear randomly; they manifest repeatedly in specific structures. The ABCD pattern is a framework for understanding and anticipating these emotional fluctuations, helping traders find opportunities during extreme market sentiments.
✔ Point A (initial extreme): In a downtrend, it represents the peak of panic; in an uptrend, it is the pinnacle of greed.
✔ Point B (first retracement): Market sentiment begins to loosen, and some traders start to question the existing trend.
✔ Point C (second retracement): The original sentiment briefly returns, often 'trapping' traders who entered too early at point B.
✔ Point D (second extreme): Emotion is completely exhausted, forming a high-probability reversal zone.
The structure of the ABCD pattern and its relationship with Fibonacci
The widespread popularity of the ABCD pattern is due to its ability to help judge trend reversals while providing relatively precise entry points. The key to recognizing this pattern lies in the interplay of price, time, and Fibonacci ratios.
In a bullish ABCD pattern:
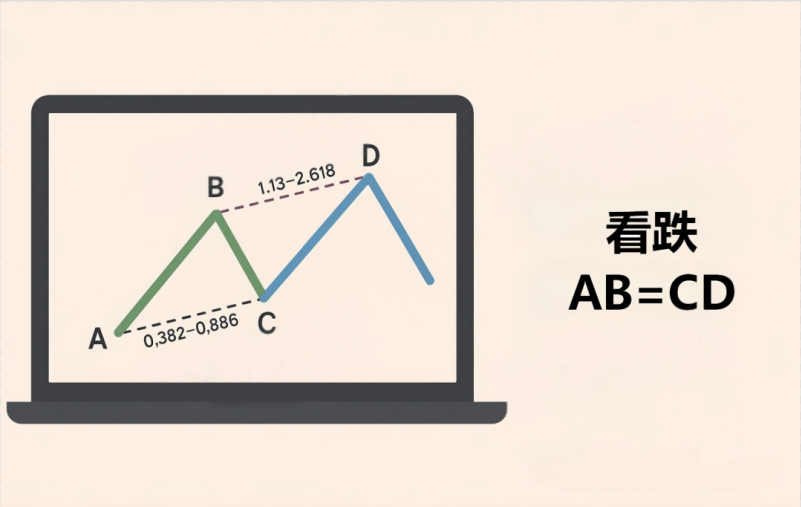
✔ The lengths or times of segments AB and CD are often equal;
✔ The BC segment usually retraces 61.8%–78.6% of the AB segment;
✔ The extension of the CD segment to BC commonly targets 127.2% or 161.8%, forming more precise entry areas.
The ABCD pattern is widely present across different varieties and cycles, making it a highly versatile analysis tool in forex, stocks, and other markets. Many traders continuously refine their ABCD trading strategies using backtesting tools and historical data like TradingSim, which further illustrates the practical value of this pattern in modern trading systems.
Truly understanding the market psychology behind the ABCD pattern will give traders a significant advantage. Just recognizing what the pattern looks like can occasionally lead to profits, but to use it 'consistently and effectively,' you must understand why it works. With this understanding, you will feel more confident placing orders and can adjust your strategy flexibly according to different market conditions. Combining the ABCD pattern with other technical analysis tools and the overall market context often leads to a significant increase in success rates.
Discovering high-win-rate ABCD patterns that others find hard to detect
Identifying 'textbook' ABCD patterns is one thing; identifying truly profitable patterns is entirely another. Seasoned traders know that not every ABCD pattern is worth trading. They possess the ability to distinguish between high-probability opportunities and false signals, the latter often being the traps that beginners are most likely to fall into.
This judgment comes from sensitivity to the details of the pattern and a comprehensive understanding of the current market environment. The pattern itself is merely a framework, while the market context is the soul.
Improve the accuracy of the ABCD pattern through verification
In ABCD pattern trading, 'verification' is a critical step. Merely drawing the pattern is far from enough; you need to confirm whether it really holds using other tools. Proper verification can significantly increase the probability of trading success.
Common verification methods include:
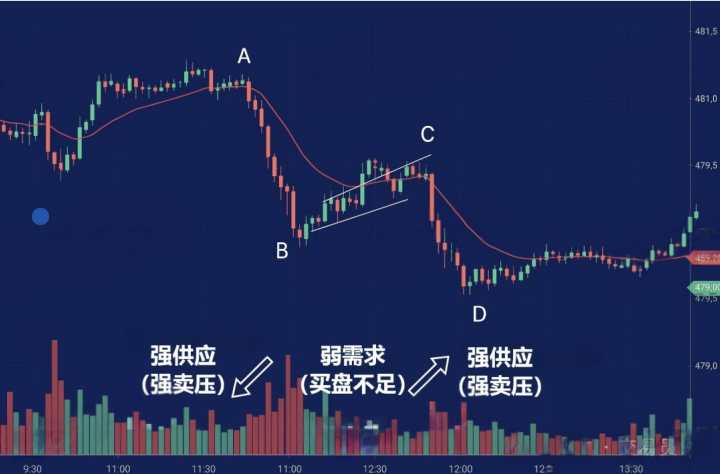
✔ Volume analysis: Focus on the volume changes during the CD segment. If the CD segment shows increased volume, it indicates strong momentum towards the expected breakout direction; if the volume gradually decreases during the BC retracement phase, it enhances the pattern's reliability.
✔ Broader market environment: Consider the larger trend. If the ABCD pattern appears in an upward trend, it is more likely to evolve into a continuation of the rise; if it appears in a downward trend, it is more likely to signify a trend reversal.
✔ Auxiliary indicator confirmation: can be used in conjunction with indicators such as RSI and moving averages to confirm whether the market is in overbought or oversold conditions, as well as the overall trend direction, adding an extra layer of 'insurance' to the pattern.
Through these verification methods, traders can effectively filter out lower-quality patterns and focus their energy on higher-probability opportunities.
Comparison of bullish ABCD and bearish ABCD pattern characteristics:
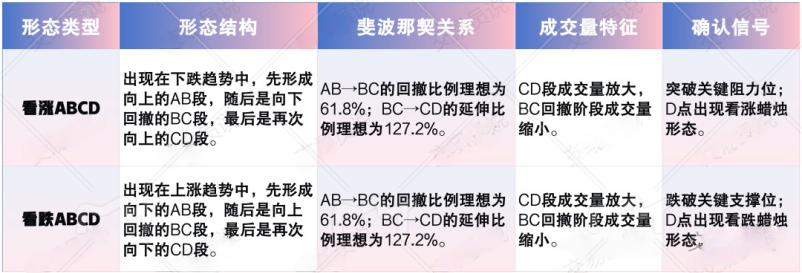
This table highlights the core differences between bullish and bearish ABCD patterns, mainly comparing aspects such as pattern structure, Fibonacci relationships, volume changes, and confirmation signals. Understanding these differences is key to accurately identifying and trading the ABCD pattern.
The following infographic further illustrates the importance of Fibonacci retracement ratios in ABCD pattern trading.
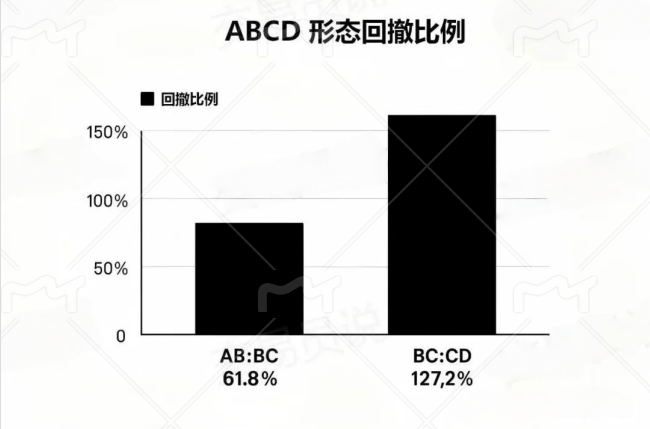
Identifying these retracements is crucial for accurately confirming the pattern and reasonably setting profit-taking and stop-loss levels. Of course, in a highly volatile market, some patterns still hold trading value even without fully matching the 'ideal ratios', but these opportunities require more cautious handling and should be combined with more confirmation signals.
Entry timing: the key to determining the success or failure of a trade.
Even if the pattern structure is perfect and verification is sufficient, if the timing for entry is wrong, it can still lead to losses. Therefore, grasping the timing of entry is a very core aspect of ABCD pattern trading.
✔ Entry at point D (conventional practice): The most common method is to enter near point D, anticipating a trend reversal. If you can wait for additional confirmation signals, such as reversal candlestick patterns or effective breakthroughs/breakdowns of trend lines, it often significantly improves the risk-reward ratio.
✔ Early entry (aggressive): Some traders choose to enter before point D is fully formed, hoping to capture a larger segment of the market. This approach has higher potential returns but also significantly increased risk, so strict stop-loss settings are necessary.
✔ Delayed entry (conservative): A more conservative approach is to enter only after the price has truly broken through the pattern structure from point D, confirming that a reversal has occurred. This approach carries lower risk but usually sacrifices part of the initial price movement.
By continuously practicing these verification methods and entry rhythms, traders can significantly enhance their ability to recognize and grasp high-win-rate ABCD patterns. However, it is important to emphasize that this 'proficiency' comes from long-term practice, patience, and a comprehensive understanding of market structure.
The power of Fibonacci: Mathematical advantages in ABCD trading
The ABCD pattern itself is not difficult to identify on charts, but what truly gives it a trading advantage is its combination with Fibonacci ratios.
Fibonacci ratios are derived from mathematical sequences, providing an objective framework for validating ABCD patterns, helping traders more accurately determine entry and exit points.
This not only helps set reasonable profit targets but also optimizes risk control, while filtering out patterns with lower reliability and focusing solely on high-probability opportunities.
The most critical Fibonacci ratio in ABCD trading
In ABCD pattern trading, several groups of Fibonacci ratios are particularly important, as they are used to locate potential turning points and are also important references for profit-taking and stop-loss.
✔ The BC segment usually retraces 61.8% – 78.6% of the AB segment
✔ CD segment: Ideally extends to 127.2% or 161.8% of the BC segment
These ratios are not coincidental; they reflect the emotional rhythms and trading behavior patterns that repeatedly occur in the market.
Using Fibonacci to validate the ABCD pattern
Fibonacci ratios can effectively help you confirm whether an ABCD pattern is 'reliable'.
If the BC retracement significantly deviates from the 61.8%–78.6% range, it may indicate insufficient strength in the pattern; similarly, if the CD segment does not reach the expected extension targets of 127.2%–161.8%, caution should be exercised.
This does not mean the pattern is necessarily invalid, but it must be combined with other technical tools for secondary confirmation. Combining Fibonacci analysis with other technical indicators (such as trend structure, momentum indicators, platform tools, etc.) can significantly enhance trading confidence.
The application of Fibonacci in practice
Fibonacci is not a 'theoretical tool' but a practical method that can be directly applied. It can help you project reasonable profit targets through the pattern structure and set scientific stop-loss levels to control losses when a pattern fails.
For example, in a bullish ABCD pattern, the stop-loss is usually set below point A; in a bearish ABCD pattern, it can be set above point A. Truly mastering these ratios is key to achieving 'maximizing profits + minimizing risks', which requires repeated practice and continuous verification in real or simulated trading.
Truly effective ABCD trading strategies
Understanding the psychological logic behind the ABCD pattern and the Fibonacci ratios is just the foundation; what truly distinguishes traders is their practical execution ability. Stable profitability does not come from occasionally catching a beautiful pattern but from repeatedly and rationally executing the same logic in different market environments.
Entry timing determines the upper limit of profits.
In the ABCD pattern, knowing when to enter is often more important than 'where to enter.'
✔ Entry at point D (mainstream practice): The most common method is to wait for reversal confirmation near point D. Confirming signals through reversal candlesticks or trend line breaks helps improve the risk-reward ratio. This practice involves confirming that a reversal has occurred before actual capital intervention.
✔ Early entry (aggressive): Entering slightly earlier before D point is fully formed aims to capture a larger potential market movement. This approach carries higher risks, but the corresponding potential rewards are also greater. When using this strategy, strict stop-loss settings must be followed; otherwise, a single mistake could lead to significant losses.
✔ Delayed entry (conservative): Entering only after the price effectively breaks through D point and confirms the reversal. This method reduces the risk of incorrect judgments but comes at the cost of potentially missing part of the initial price movement. It emphasizes confirmation over the profit of being first.
To better understand the various components of the ABCD pattern trading strategy, we can systematically organize them through a table.
Overview of core elements of the ABCD pattern trading strategy:

This table summarizes different entry methods and key elements in ABCD pattern trading, while also pointing out common traps and important factors that determine the success or failure of trades.
Flexibly adjust strategies based on different market environments
Successful ABCD pattern traders adjust their tactics based on different market conditions. There is no fixed method that applies to all market situations.
✔ Trending market: In a strong trend, the CD segment often extends beyond common Fibonacci extension ratios (such as 127.2% or 161.8% of BC). At this time, traders can choose to move their stop-loss or adopt a gradual profit-taking strategy to lock in profits as the trend continues.
✔ Consolidating market: During a range consolidation phase, the ABCD pattern more often reflects short-term reversal signals within the range. At this time, expectations for profit should be lowered, tighter target levels should be set, and one should always be prepared for quick reversals. It is particularly important to use the ABCD pattern in conjunction with key support and resistance levels.
✔ High volatility market: In highly volatile markets, price movements are often irregular, making it harder to measure Fibonacci ratios accurately. In such environments, more indicators should be used for confirmation, and stop-loss spaces should be appropriately broadened to cope with additional risks brought by volatility.
Differences in execution methods across different markets
Professional traders adjust the execution details of the ABCD pattern based on the type of market they are trading.
✔ Cryptocurrency market: The crypto market is highly volatile, and risk control must be emphasized more when trading the ABCD pattern. Wider stop-loss settings and confirmation from more technical indicators are particularly important in this market.
By mastering these execution techniques, traders can significantly enhance the overall success rate of ABCD pattern trading. The key to long-term stable profits is not to completely avoid losses, but to repeatedly seize high-probability trading opportunities while controlling risk.
And this requires ongoing practice, continual adjustments, and a comprehensive understanding of the market.
The risk management secrets of professional ABCD traders
To achieve long-term and stable profits through the ABCD pattern, the key is not just finding a 'perfect entry point', but whether the risk management is solid enough. This means protecting the principal when inevitable losses occur and maximizing profits in successful trades.
You can think of professional traders as professional gamblers. They know exactly where the casino's probability advantage lies, so they manage their funds very rigorously to ensure they can stay at the table. When using the ABCD pattern, professional traders essentially apply the same thought process.
Protective stop-loss based on pattern structure
Unlike randomly setting a fixed stop-loss ratio, professional traders' stop-losses are directly based on the ABCD pattern structure, making risk control more reasonable and effective.
✔ Stop-loss positioning: In a bullish ABCD pattern, stop-loss is usually set below point A, which is a key support level. Once the price effectively breaks below here, it indicates that the pattern has failed and you must exit decisively. In a bearish ABCD pattern, the stop-loss is set above point A.
✔ Dynamic stop-loss (trailing stop): When the market develops as expected, the stop-loss can continuously move up (or down) with the price, locking in existing profits while allowing the trend to continue as long as possible. This method allows for capturing larger market movements while effectively preventing losses from sudden reversals.
This structure-based stop-loss method makes risk management more flexible and adaptable to different ABCD pattern environments.
Dynamically adjust positions for each trade
Position control is another extremely critical aspect of risk management. Professional traders never use the same position size for every trade but flexibly adjust their capital based on the risk level of different ABCD patterns.
✔ Volatility factors: In highly volatile markets, position sizes are actively reduced to limit potential losses from single trades.
✔ Degree of certainty: If an ABCD pattern receives more confirmation signals (such as trends, support and resistance, indicator resonance), traders may appropriately increase their position sizes. However, even so, risks must still be controlled within acceptable limits.
This flexible position management method helps optimize the risk-reward ratio while protecting account safety in different market environments.
Asymmetric risk-reward ratios and emotional discipline
Professional ABCD traders often deliberately pursue an asymmetric risk-reward structure, meaning losing small amounts while making large profits. For example, a 1:3 risk-reward ratio means for every $1 risked, aiming for a potential return of $3.
✔ Gradual entry and exit (adding or reducing positions): During trading, some traders adopt a gradual entry and exit strategy to optimize risk structure while improving overall returns.
✔ Emotional control: Ultimately, the hardest part of risk management is not the technique, but the emotions. When the market moves against you, fear amplifies; when profits expand, greed arises. A true professional trader can strictly execute the established plan without being led by emotions.
As long as you can consistently adhere to the pre-established risk rules, advantages will naturally show over the long term. By combining these risk management principles with the technical advantages of the ABCD pattern itself, traders can significantly enhance the consistency and long-term profitability of their trades. Technical analysis + risk management is the true foundation for a stable trading system.
This is the trading experience that Yan An shares with everyone today. Many times, your doubts have caused you to miss many profitable opportunities. If you do not dare to try boldly, to engage, to understand, how will you know the pros and cons? You can only know what the next step is after taking the first step. A warm cup of tea, a word of advice, I am both a teacher and a friend you can talk to.
Fate brings us together, and knowing each other is a matter of destiny. I firmly believe that those destined to meet will eventually do so, while those who pass by without meeting is fate. The journey of investment is long, and momentary gains and losses are merely the tip of the iceberg. One must understand that even the wisest can overlook something, and those who are overly cautious may occasionally benefit. No matter how emotions fluctuate, time will never stand still for you. Set aside your worries and rise again to move forward.
The secret manual has been given to you all; whether you can become famous in the world depends on yourself.
These methods should definitely be saved by everyone. If you find them useful, please share them with more people around you who trade cryptocurrencies, follow me for more valuable insights in the crypto space. Having been through the rain, I am willing to hold an umbrella for you! Follow me, and let's walk the path of cryptocurrency together!


