---
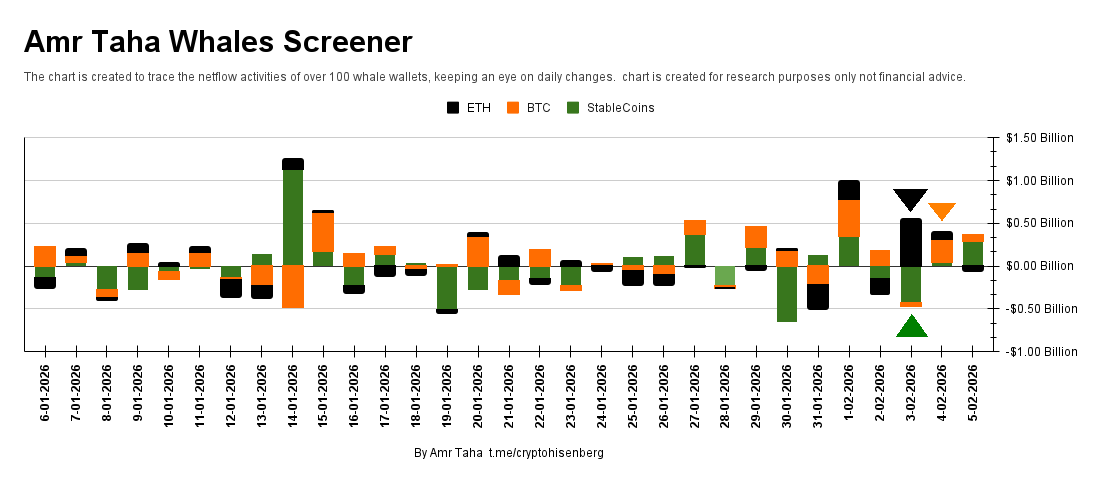
📊 1. AMR TAHA WHALE SCREENER - Tracking 100+ Whale Wallets
What This Chart Shows:
· Daily netflow tracking of major whales
· Three asset classes: ETH, BTC, Stablecoins
· Time period: January 6 to February 5, 2026
Key Observations:
1. BTC Whale Movements:
· Increased outflows from late January
· Peak outflow around February 2-3 (matches crash dates)
· Current: Still net negative flows
2. ETH Whale Movements:
· Similar pattern to BTC
· Slightly less severe outflows
· Some accumulation in mid-January, then distribution
3. Stablecoin Movements:
· Whales accumulating stablecoins since January 20
· Classic risk-off behavior
· Preparing cash for potential buys or preserving value
Conclusion: Whales have been net sellers throughout the recent crash, while accumulating stablecoins.
---
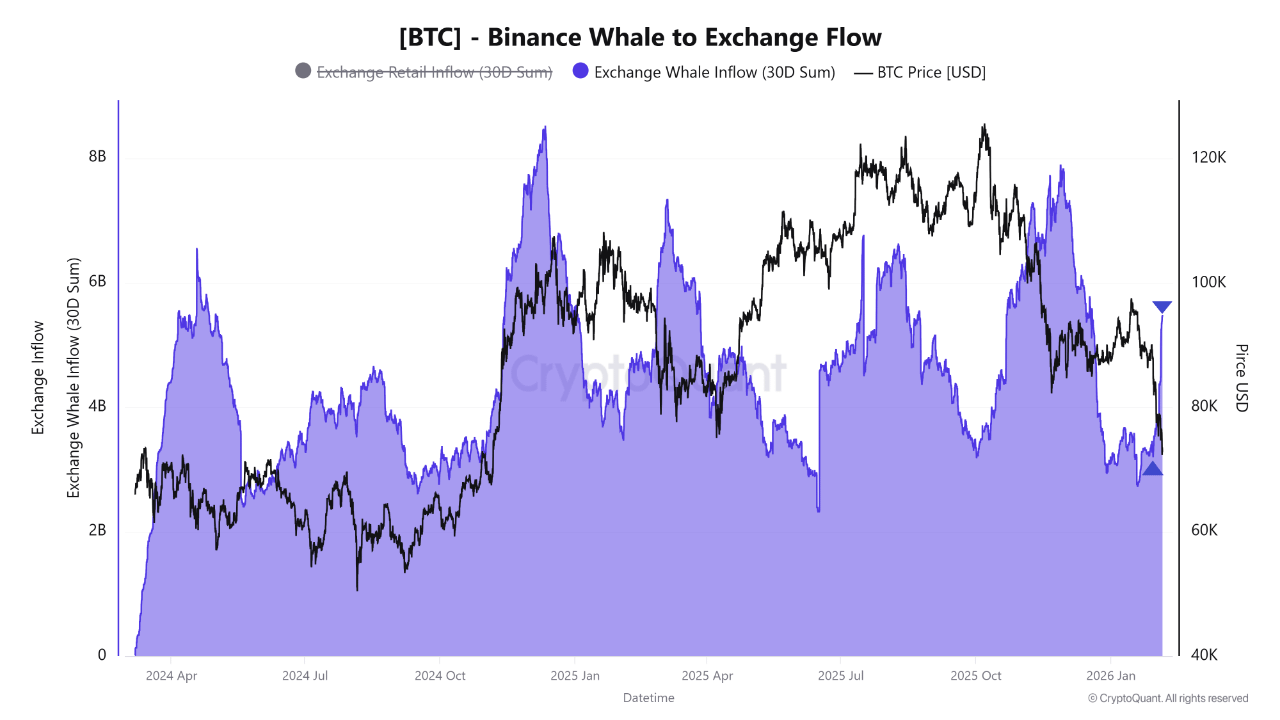
💱 2. EXCHANGE RATE TABLE - Bitcoin Mining Economics
Data Analysis:
Date Exchange Rate (BTC) Exchange Rate (USD) Price (USD)
2024 Apr 3.5 2.865 ~$82K
2024 Jul 3.0 2.545 ~$85K
2024 Oct 3.5 2.860 ~$82K
2025 Jan 6.0 5.085 ~$85K
2025 Apr 5.5 4.570 ~$83K
2025 Jul 6.5 5.080 ~$78K
2025 Oct 7.5 6.090 ~$81K
2026 Jan 6.0 5.075 ~$85K
Interpretation:
· Exchange Rate (BTC): BTC earned per energy unit
· Exchange Rate (USD): USD earned per energy unit
· Trend: Mining profitability peaked October 2025
· Current (Jan 2026): Profitability declining from peak
Impact: Less profitable mining → miners may need to sell more BTC to cover costs → adds selling pressure.
---
🐋 3. RETAIL vs WHALE BEHAVIOR ANALYSIS
7-Day Average Holdings (USD Value):
Date BTC Price Retail Mid-Size Whales
2025 Mar 98K 100K 95K 80K
2025 Oct 125K 122K 90K 85K
2026 Jan 85K 82K 75K 70K
2026 Feb 80K 78K 70K 65K
Critical Patterns:
1. Retail Leading at Tops:
· March 2025: Retail held MORE than whales (100K vs 80K)
· October 2025: Retail 122K vs Whales 85K
· Retail was more bullish at peaks
2. Whales Leading Downsides:
· Current: Whales at 65K vs Retail at 78K
· Whales reduced exposure FASTER
· Smart money exited first
3. Current Divergence:
· Retail still holds 20% more value than whales
· This gap needs to close for market bottom
· Either retail sells more, or whales buy back
---
🎯 SYNTHESIS: WHAT ALL 3 CHARTS REVEAL
The Complete Picture:
Phase 1 (2025 Peak):
· Retail FOMO at $125K
· Whales quietly distributing
· Mining profitability high
Phase 2 (Jan-Feb 2026 Crash):
· Whale net outflows accelerate
· Retail still holding relatively more
· Mining profitability declining
· Whales accumulate stablecoins (risk-off)
Phase 3 (Current):
· Price: $71K (-43% from ATH)
· Whales: Net sellers, in stablecoins
· Retail: Still overexposed vs whales
· Miners: Facing profitability pressure
---
💡 TRADING IMPLICATIONS:
Market Bottom Signals to Watch:
1. Whale Netflows Turn Positive:
· BTC inflows > outflows
· Stablecoin accumulation stops
2. Retail/Whale Gap Closes:
· Either retail capitulation (sells)
· Or whale accumulation (buys)
· Currently: Retail still needs to sell more
3. Mining Profitability Stabilizes:
· Exchange rates stop declining
· Miner selling pressure eases
Current Status:
· Bottom NOT confirmed (whales still net sellers)
· More pain likely (retail still relatively heavy)
· Target zone: $60K-$65K where gaps might close
---
⚠️ RISK ASSESSMENT:
High Risk Factors:
1. Whale selling continues
2. Retail hasn't fully capitulated
3. Miner profitability declining
4. Stablecoin accumulation = waiting for lower prices
Potential Catalysts for Reversal:
1. Whale netflows turn positive
2. Retail panic selling (capitulation)
3. Mining difficulty adjustment
4. Macro turnaround (Fed pivots)
---
📌 ACTIONABLE INSIGHTS:
For Short-term Traders:
· Wait for whale netflow reversal signal
· Watch $69K support (if breaks, $65K next)
· Don't fight whale momentum
For Long-term Investors:
· Accumulation starts when:
· Whale buying resumes
· Retail/whale gap narrows
· Mining stress peaks (miner capitulation)
· DCA slowly into $65K-$60K zone
For Miners/Validators:
· Prepare for lower profitability
· Hedge with futures if possible
· Consider energy cost optimization
---
🔮 FORECAST: NEXT 30 DAYS
Most Likely Scenario (60%):
· Test $65K support
· Retail capitulation accelerates
· Whale buying emerges at $60K-$65K
· Bottom formation late Feb/early Mar
Bull Scenario (25%):
· Rapid bounce from oversold
· Whale buying at current levels
· Quick recovery to $78K
· (Low probability given current data)
Bear Scenario (15%):
· Break below $65K
· Cascade to $55K-$60K
· Extended bear market into Q2 2026
---
Analysis based on whale tracking data, mining economics, and holder behavior patterns. Markets can change rapidly with new information.
Remember: Whales lead, retail follows. The data shows whales are still in risk-off mode. Trade accordingly.
#WhaleAnalysis s #bitcoin n #BTC☀ #MarketCycle #TradingData$BTC #CryptoResearch #WhaleWatching $ETH $BNB


