XRP price has fallen below $1.50, marking the lowest level in over 14 months. Technical signals suggest that the bearish trend could extend into February.
The XRP price chart shows a typical bearish flag pattern.
Last night, XRP dropped about 14%, from the $1.75 area to a low of $1.50, while losing the support level of $1.60—this is the first time since November 2024.
This development has pushed the price into the breakdown phase of the bearish flag pattern on the 4-hour time frame. Specifically, XRP broke through the lower trendline of the pattern on Tuesday, then bounced back to test this area as a new support level. If the test fails and the 4-hour candle closes below approximately $1.58, the risk of a deeper decline will increase.
According to the target measurement of the model (taking the initial decline height plus/minus the breakout point), the target price area is around $1.22, corresponding to a decrease of about 23% from the current level.
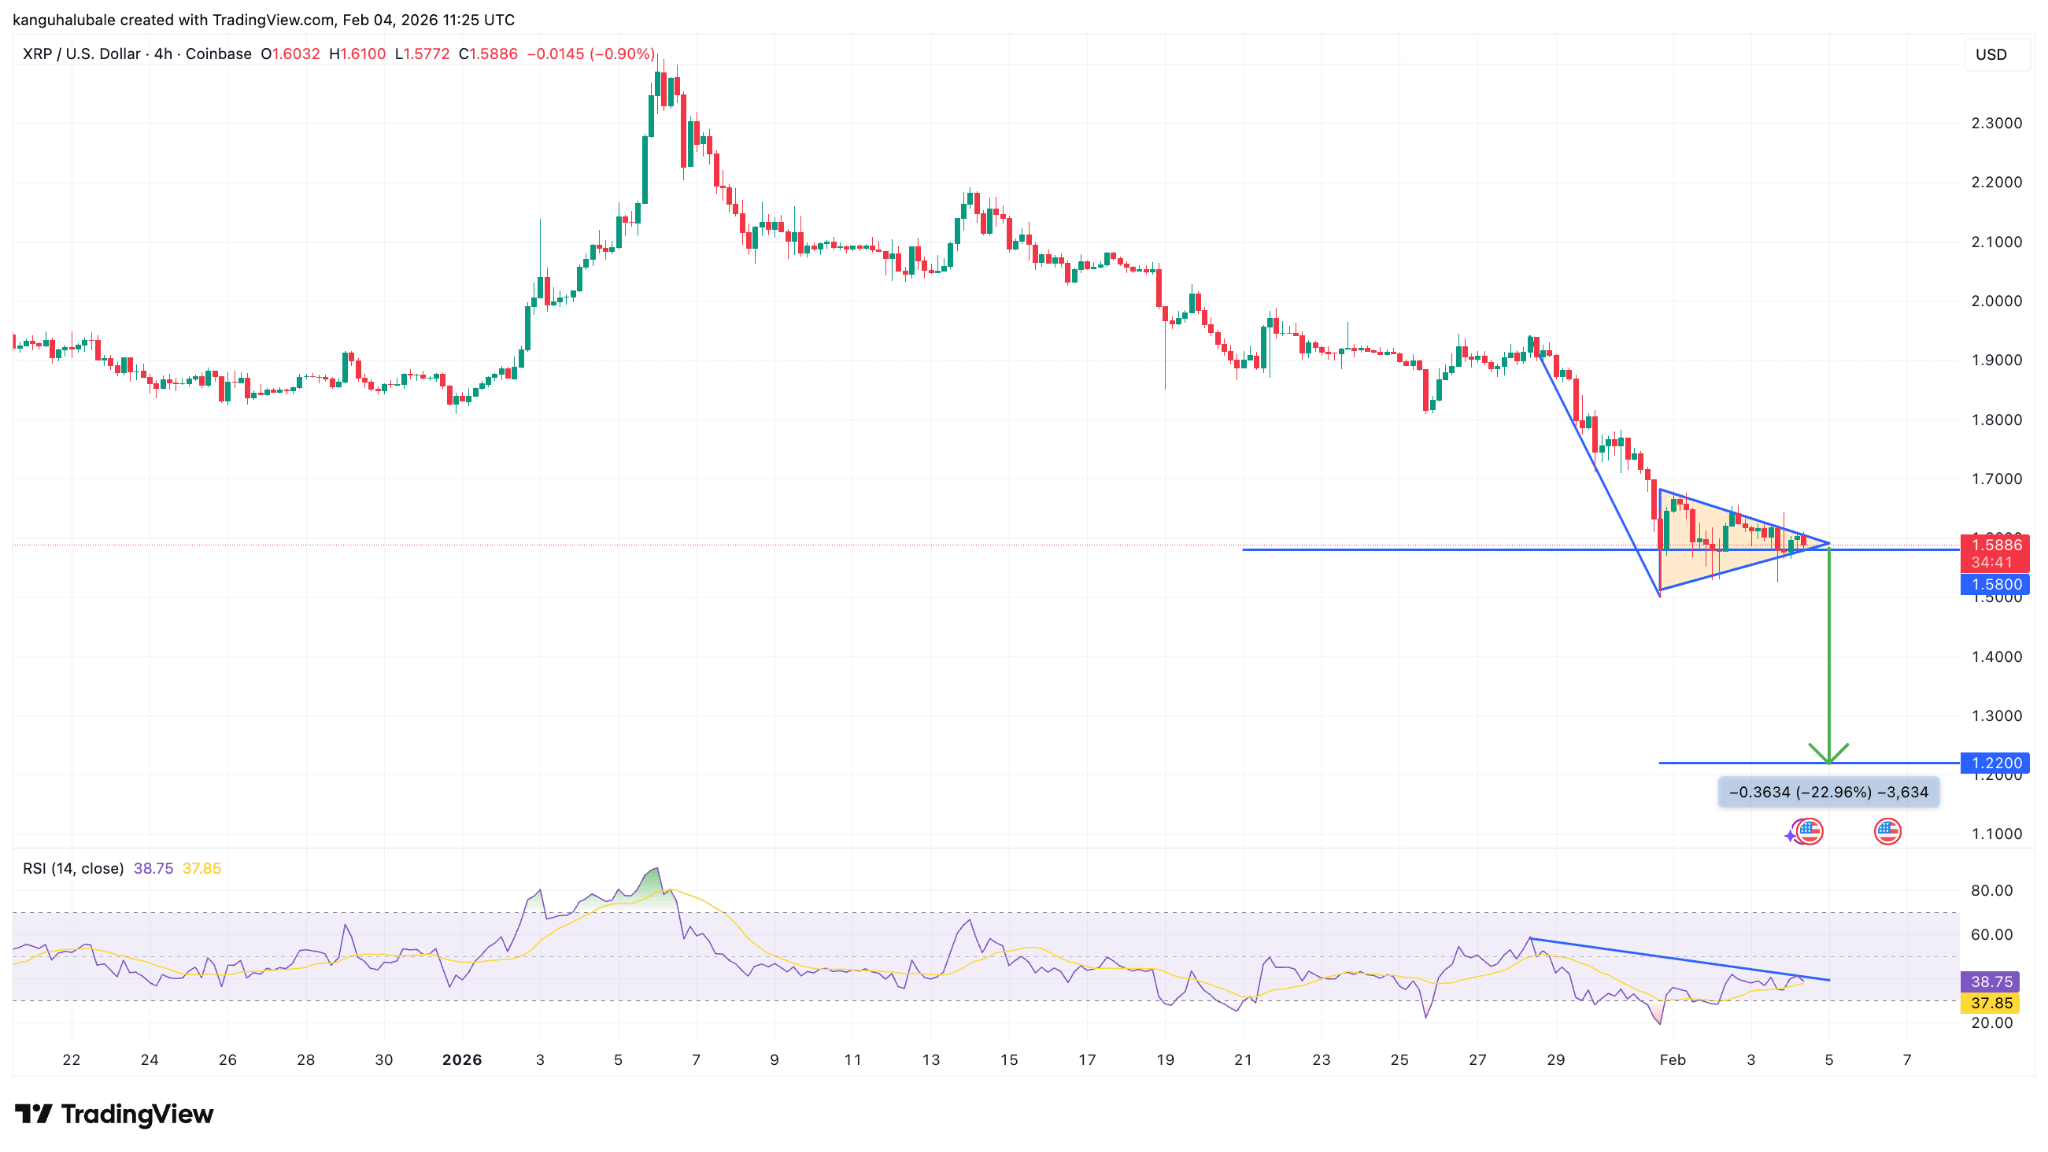 XRP/USD 4-hour chart | Source: Cointelegraph/ TradingView
Some analysts suggest that the bounce back to $2.40 in January was merely a 'false breakout' as the price quickly made a new lower low. Anonymous analyst AltCryptoGems noted that the bearish trend is still not invalidated and warned of the risk of a steep price drop in a 'lack of significant support' area.
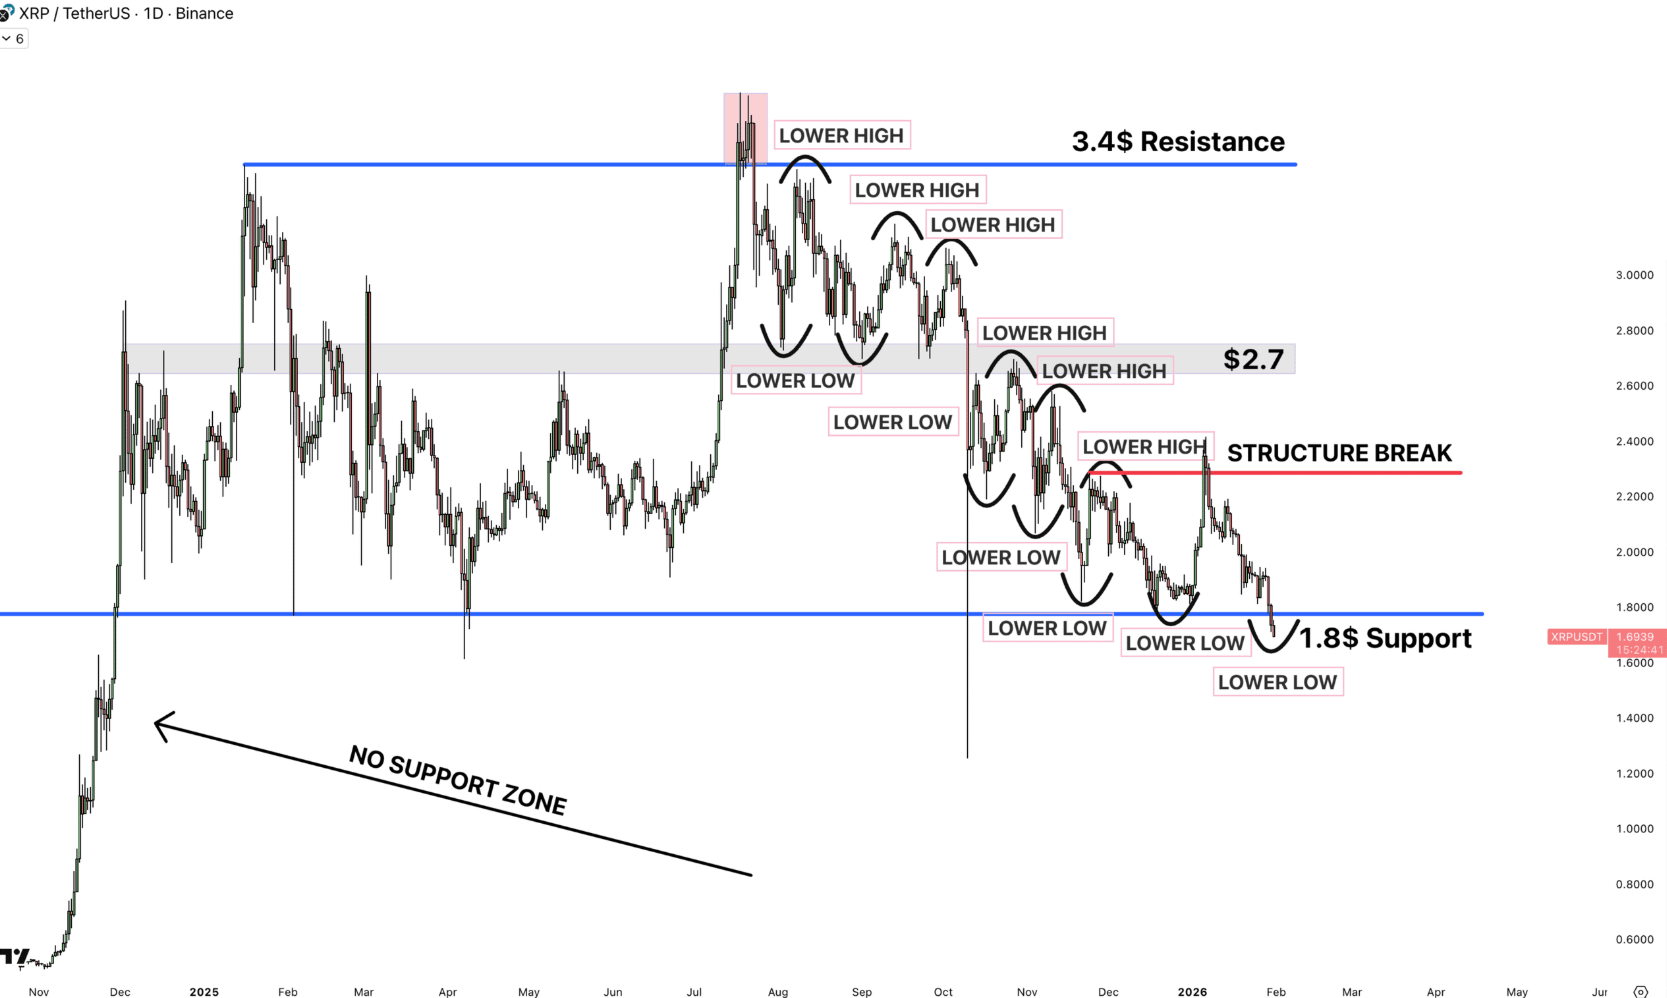 XRP/USD daily chart | Source: AltCryptoGems
Meanwhile, trader Alex Clay stated that breaking the support line of the double bottom structure at $1.60 could pave the way for a decline scenario towards $1.00 or lower.
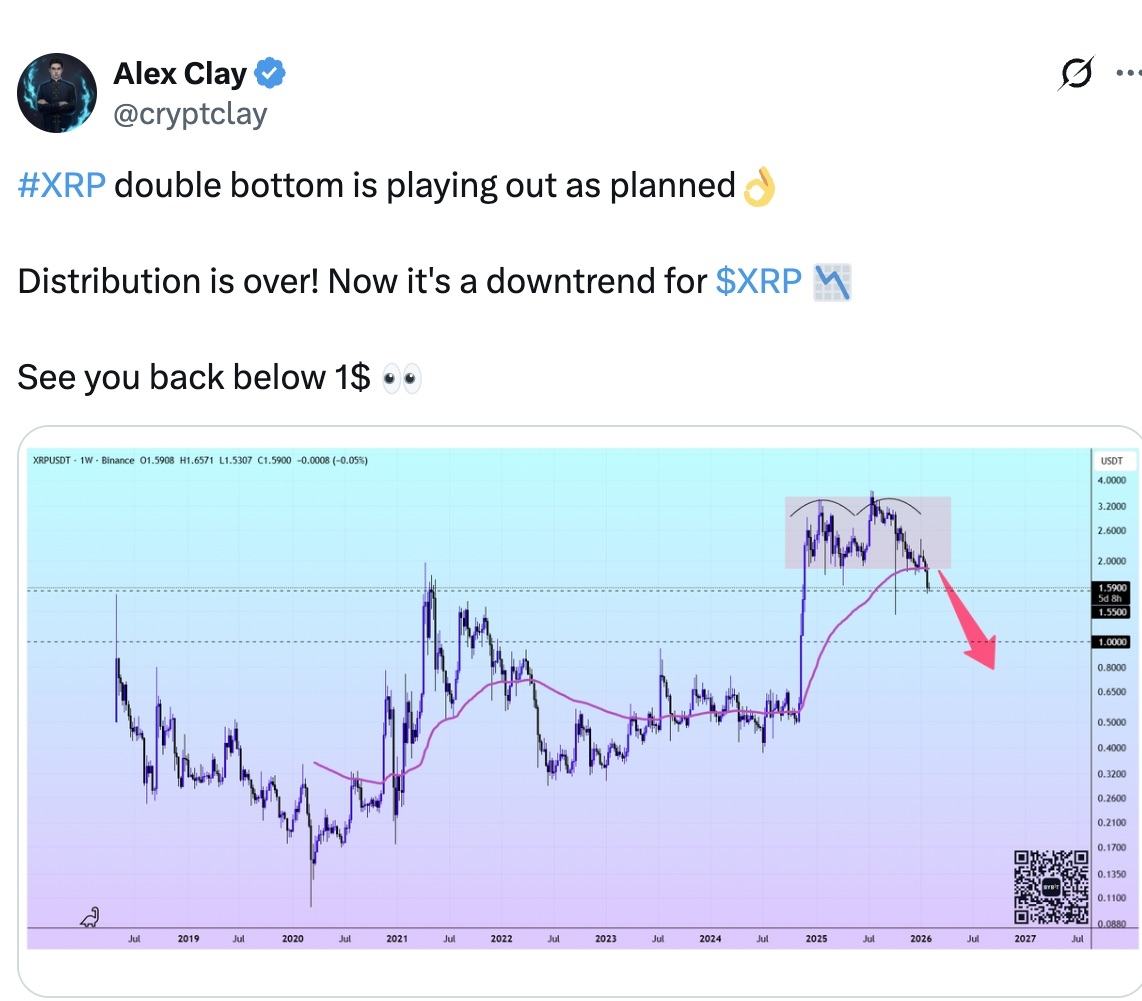 Source: X/Alex Clay
According to a report from Coinphoton, the next important support zone for XRP is near the average execution price around $1.48. If this level is breached, most average-holding investors will fall into a loss state, a scenario quite similar to the bearish phase of 2022, ultimately leading to a 50% drop to $0.30.
Buying pressure weakens, and the risk of decline remains evident.
The 90-day Spot Taker Cumulative Volume Delta (CVD)—reflecting whether buyers or sellers are more active in market orders—shows that buying pressure has significantly decreased since early January. Although buying pressure had dominated since November 2025, CryptoQuant data recorded a sharp decline in buying orders in the last 30 days.
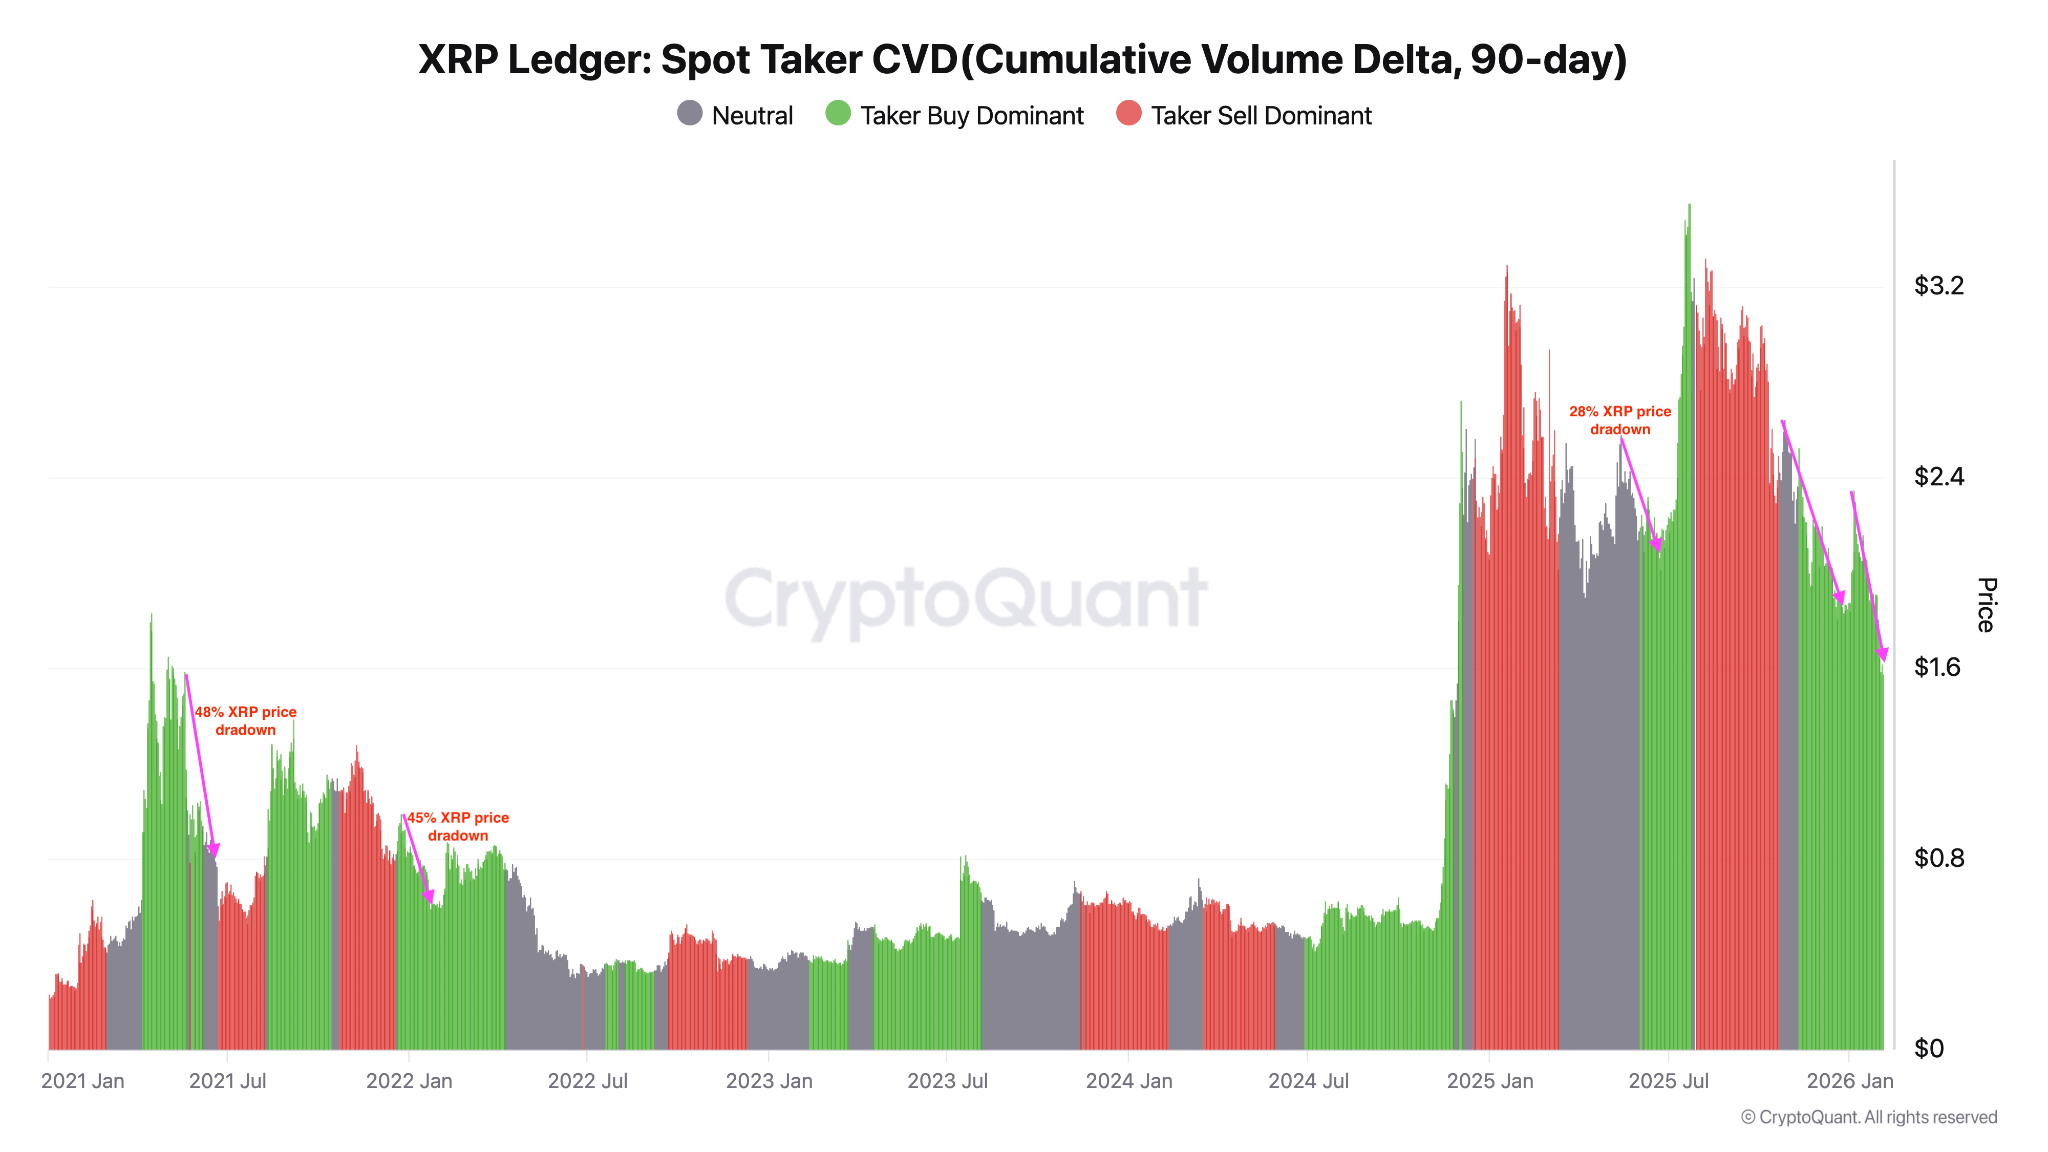 CVD, the unit of spot XRP buying | Source: CryptoQuant
This indicates that investor enthusiasm is gradually cooling, bullish momentum is weakening, and the risk of further corrections continues to rise. In the past, significant drops in CVD have often accompanied price declines of 28%–50% within just a few weeks.
However, buyers still have a notable support: Open Interest (OI) in XRP futures is significantly decreasing—from $4.55 billion (January 6) to $2.61 billion on Wednesday. When OI decreases alongside the price, this may imply that the leveraged position pressure is being 'unwound', thus weakening the bearish trend or setting the stage for a technical reversal.
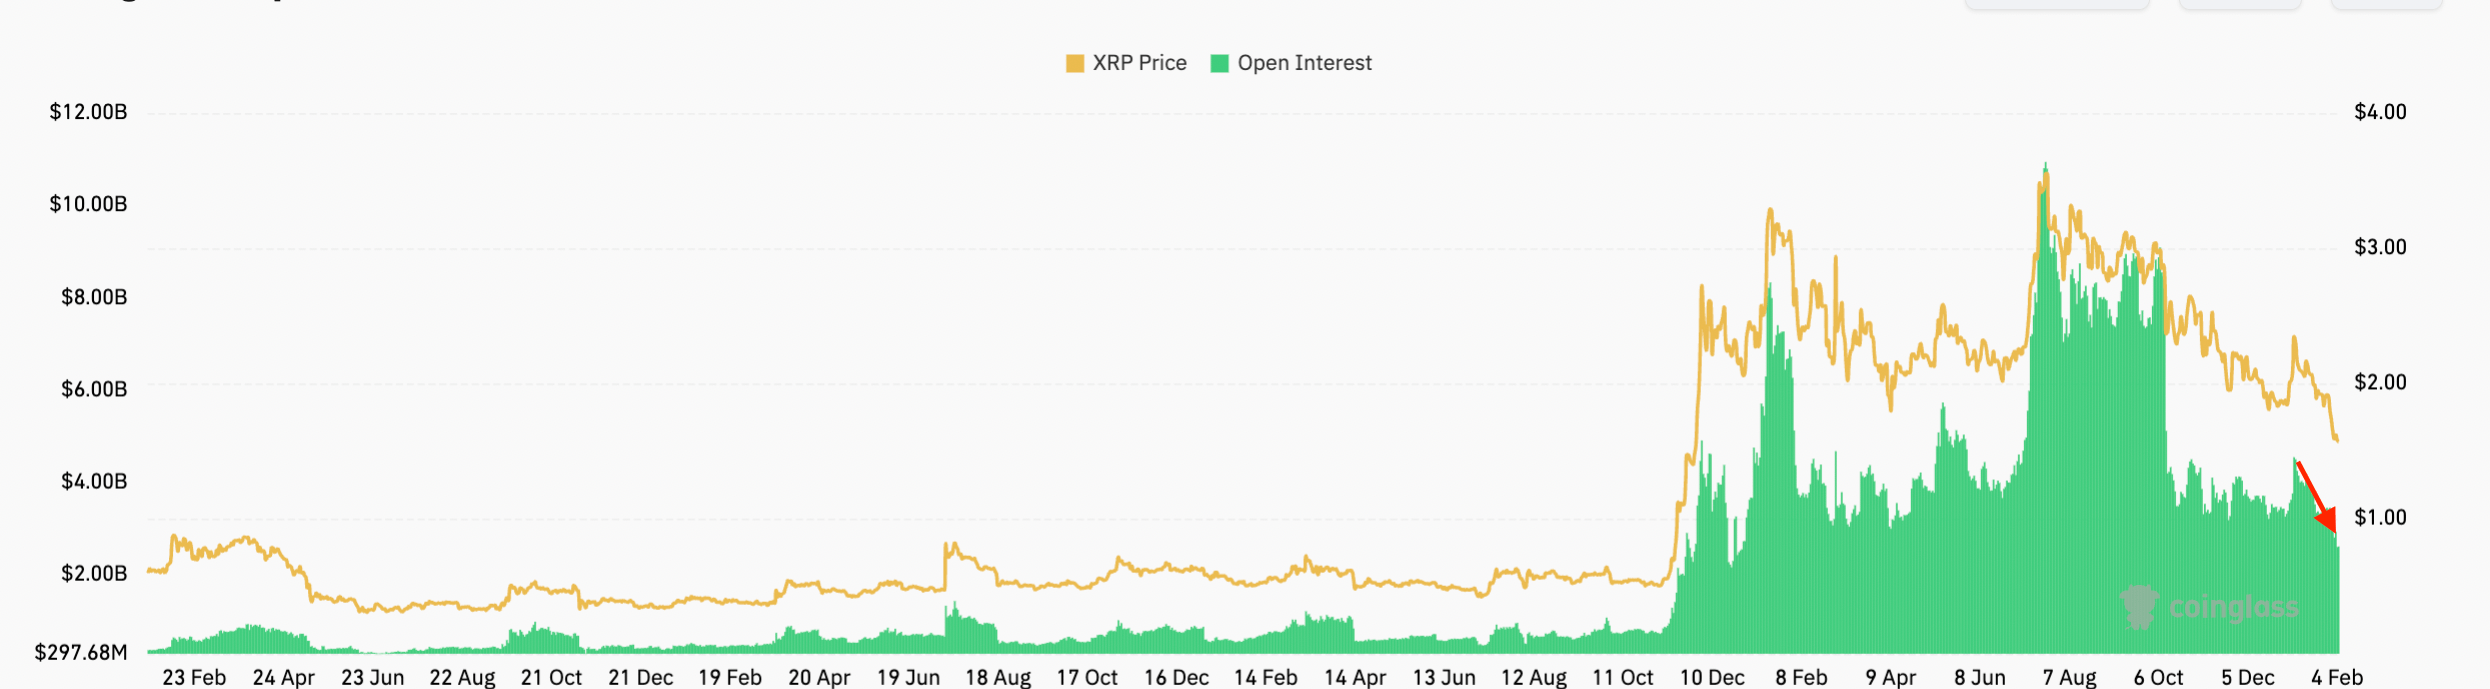 XRP open interest volume | Source: CoinGlass
If a recovery occurs, the resistance zone at $1.85 will be an important checkpoint, as this was a key support area for most of 2025.
https://coinphoton.com/gia-xrp-giam-xuong-duoi-160-do-la.html
