Analysis of the SOL coin
Based on the market performance and current data for the Solana (SOL) coin at the beginning of February 2026, here is a detailed technical and fundamental analysis, crafted in a professional style to suit your followers:
📊 Technical analysis of the SOL coin (February 2026)
The Solana coin is currently undergoing a critical "trust test" phase, where the price is facing selling pressure despite positive long-term indicators.
1. Current price situation
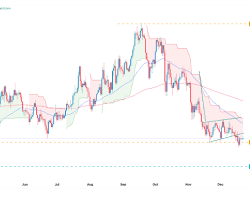
Current price: The price ranges between 92$ - 97$.
Overall trend: Bearish in the short term (the coin has lost about 26% of its value over the last 7 days), but it is trying to hold above historical support levels.
2. Support and resistance levels (Key Levels)
Identifying these points is crucial for making your next decision:
🛡️ First support (90$ - 91$): A very strong rebound area; breaking this level could push the price towards 75$.
🚧 First resistance (105$): An important psychological area; closing above it with a daily candle is the first real signal of recovery.
🚀 Major resistance (120$ - 130$): Breaking this area means returning to the upward trend and targeting levels of 150$ and above.
3. Technical indicators
RSI Indicator: Approaching the "oversold" area (below 35), suggesting that the decline may have reached its final stages and a potential rebound is imminent.
CMF Indicator: Showing a positive movement, indicating a return of liquidity into the Solana ecosystem despite the price drop.
📈 Fundamental Analysis and News
Why is the price moving like this?
Institutional flows: Unlike Bitcoin and Ethereum, Solana ETFs recorded inflows of 104 million dollars in January, indicating the confidence of large investors (Whales).
Network growth: Solana is currently recording about 10 million new addresses daily, a record number reflecting real adoption growth of the network.
Major forecasts: Standard Chartered Bank has raised its long-term forecasts for SOL, indicating the possibility of reaching very high prices (up to 2000$ by 2030) due to its superiority in the payments sector.
💡 Trader's advice (Trading Strategy)
For the quick trader: Watch the 90$ level; rebounding from it with high trading volume represents a buying opportunity targeting 105$.
For the long-term investor: Current levels (below 100$) are historically good accumulation areas, especially with the continued growth of the network and institutional inflows.
Alert: The cryptocurrency market is highly risky, and this analysis is for educational purposes and should not be considered direct financial advice. Always do your own research (DYOR).