Based on the 4-hour candlestick chart and daily chart, combined with the current market data (funding rate -0.01037%), the following is the trend analysis of $SKR (hereinafter referred to as the token).
1. Market background and sentiment analysis
Currently, the trend of $SKR shows a typical “new coin/strong whale coin” one-sided downward trend after profit-taking.
“A” shaped sell-off: From the daily chart, the token experienced a brief surge before quickly entering a value return phase of “where it came from, it will go back”. The intraday decline is close to 14%, and there are no signs of a stop in the decline, indicating a strong willingness of the main funds to withdraw, and the market is completely dominated by panic selling.
Bearish Sentiment Prevails: The current funding rate is -0.01037%. A negative rate means that the contract price is lower than the spot price (or index price), indicating that the shorting power in the market is stronger than the buying power, with bears willing to pay to hold short positions. This is usually a signal of a broadly bearish market, but it also sets the stage for a potential 'squeeze' rebound in the future (if the rate further drops significantly).
Liquidity Trap: The continuous large bearish candlesticks on the daily chart accompanied by massive trading volume (318 million) indicate that many retail investors attempted to catch the bottom during the decline and got trapped, with significant selling pressure above.
2. Technical Analysis
Daily Chart: The 'Bottomless Pit' beneath the waterfall
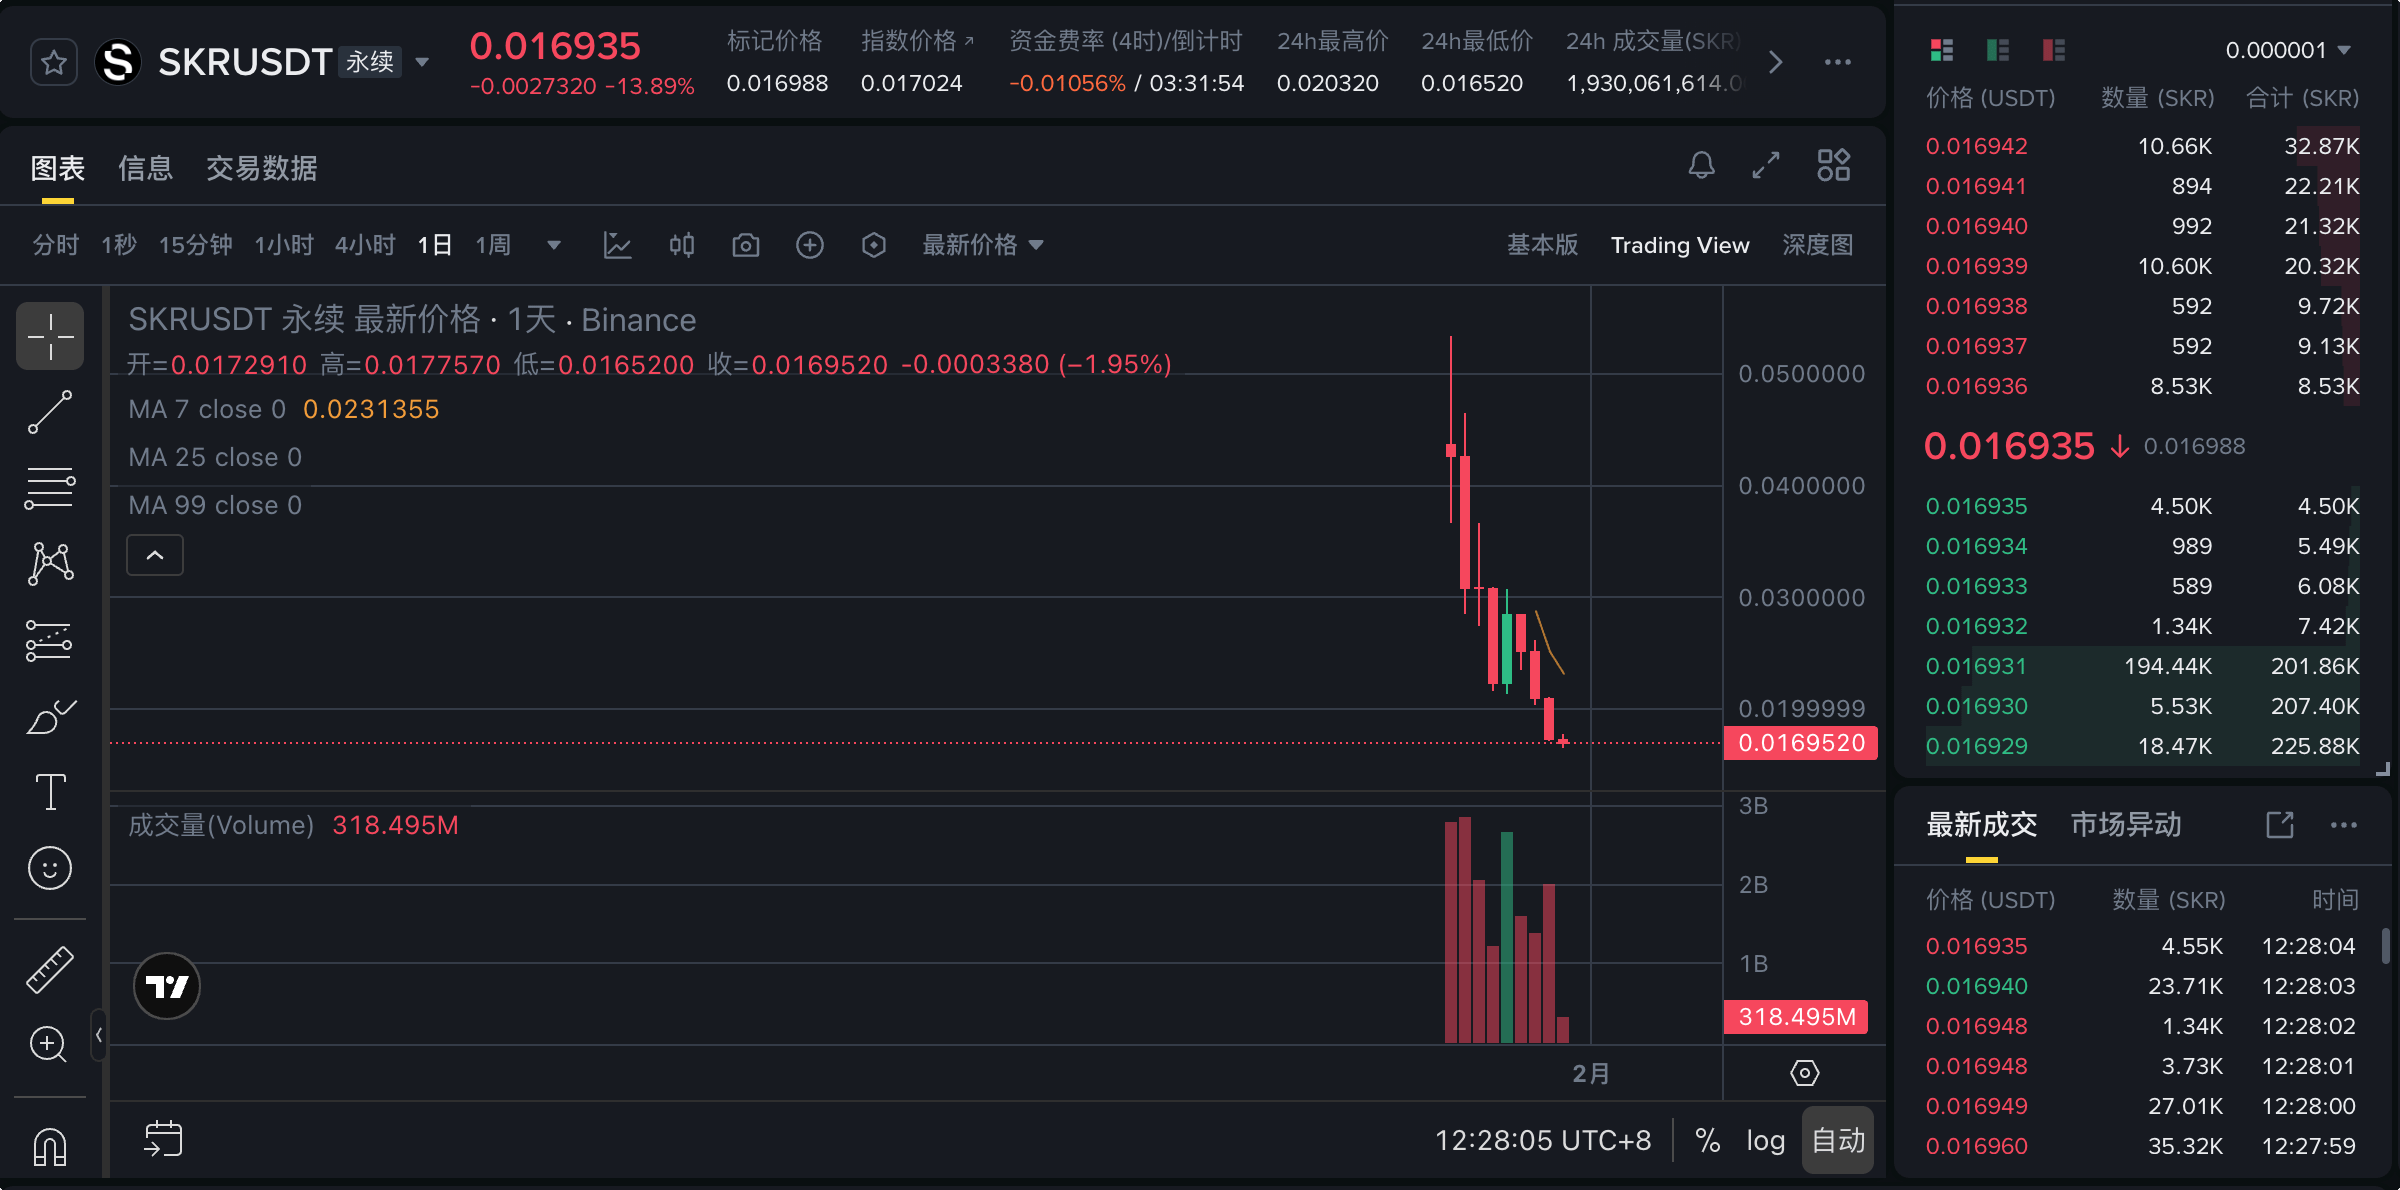
Moving Average Resistance: The daily MA7 ($0.0231) is currently hovering high above, creating a significant deviation from the current price ($0.0169). This formation is known as a 'Head Chopper,' with prices falling steeply, making it difficult to fix through simple consolidation in the short term, usually requiring a deeper decline to seek liquidity.
Support Failure: The previous daily low of $0.0165 is facing severe testing. If the price breaks below this level, it will enter a 'price discovery' blind spot, theoretically lacking clear technical support levels.
4-Hour Chart: A perfect descending channel
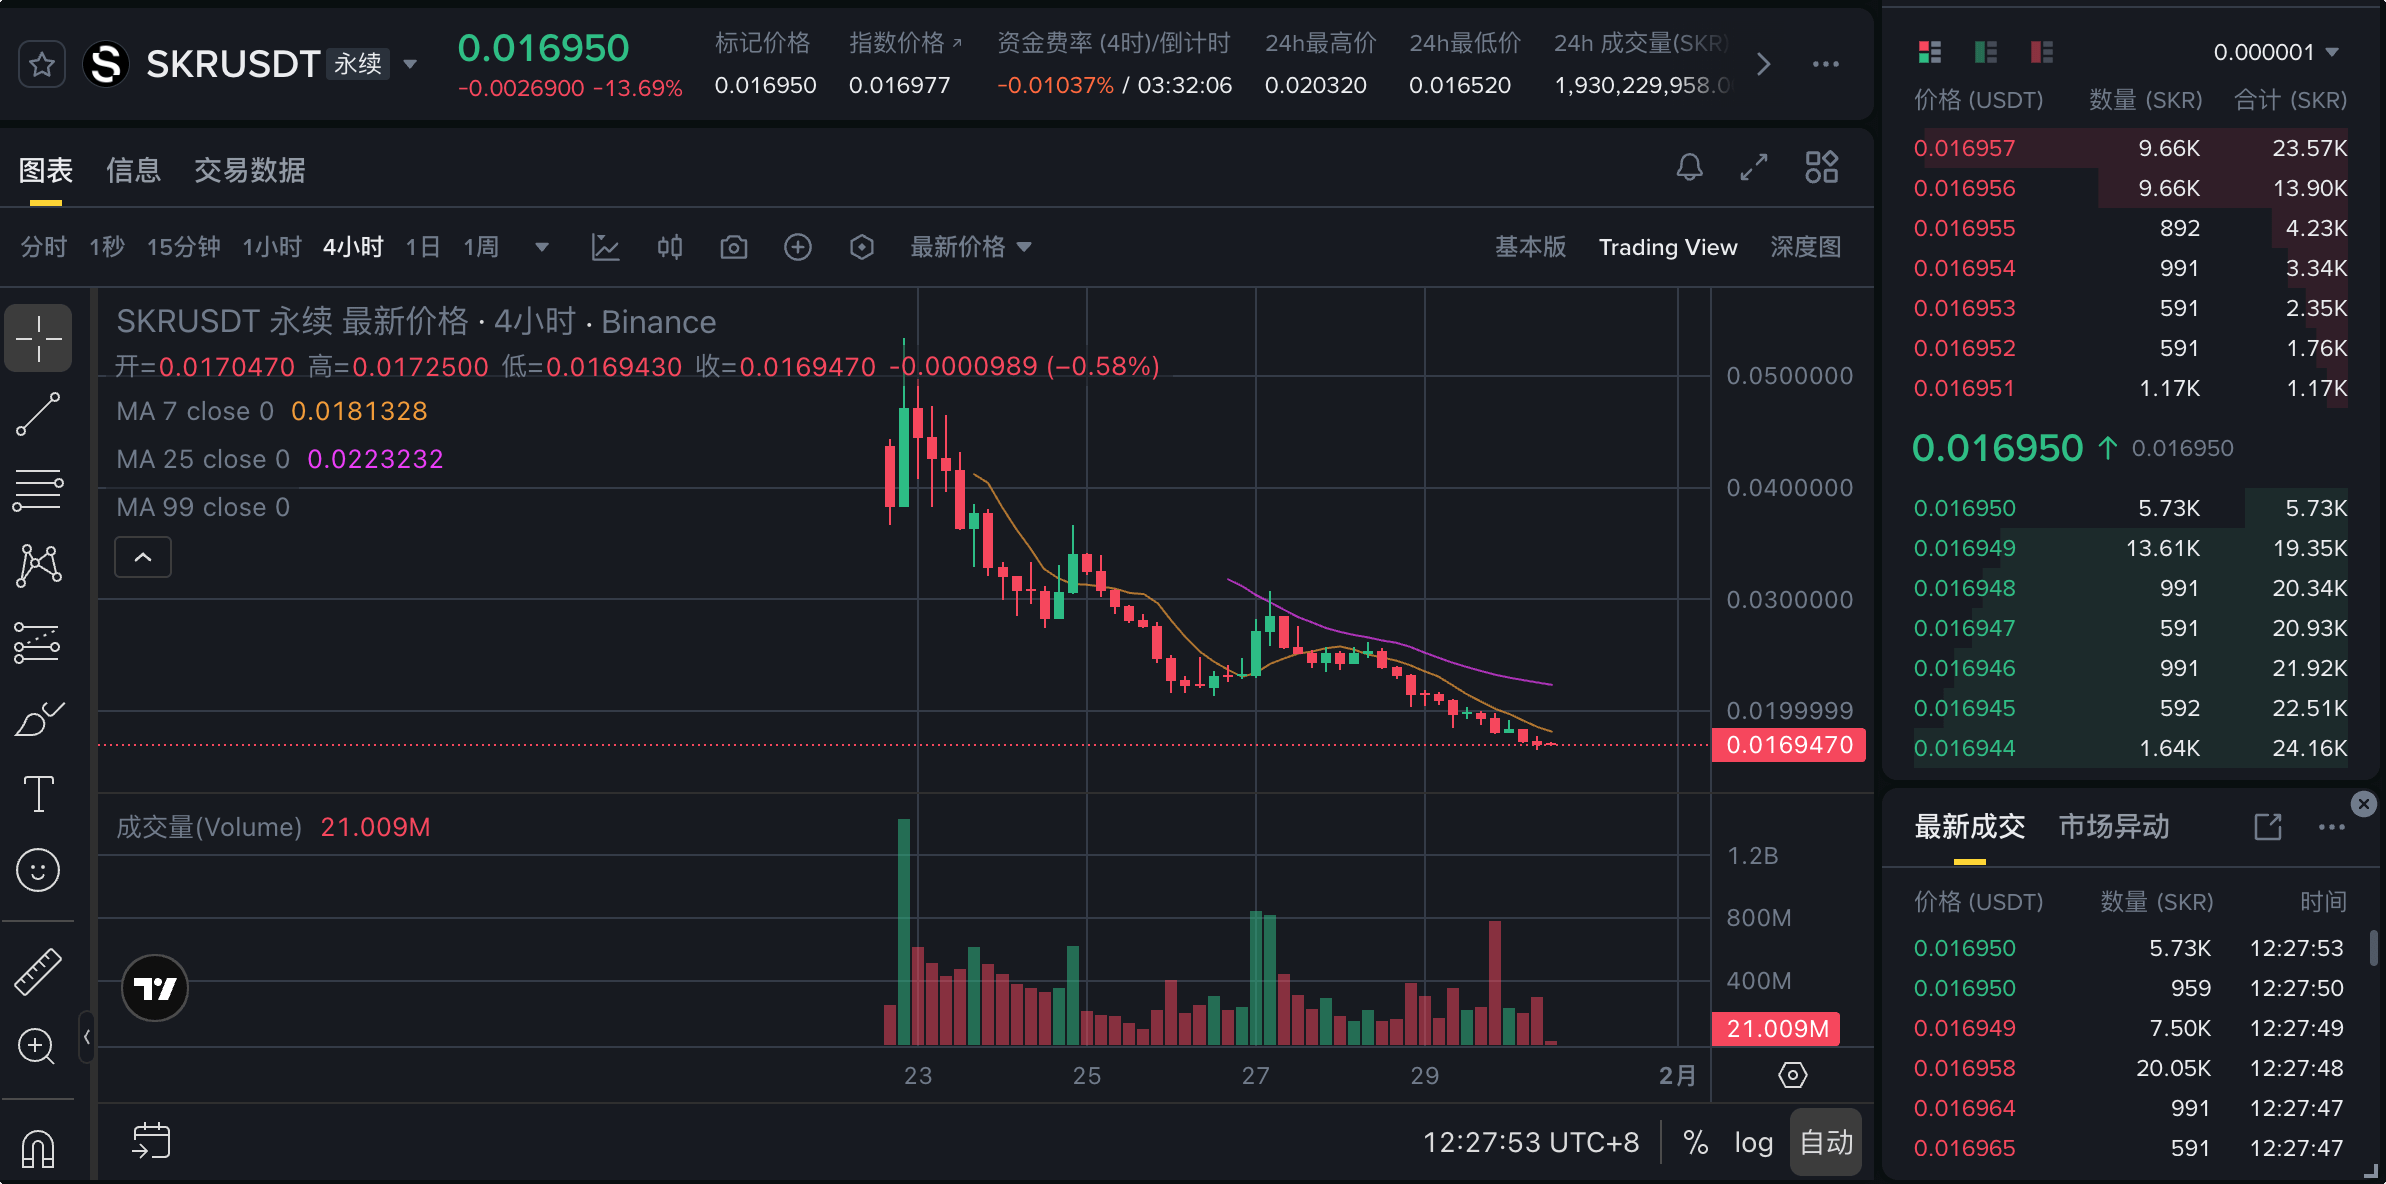
Dynamic Resistance: On the 4-hour chart, MA7 ($0.0181) and MA25 ($0.0223) show a standard bearish arrangement. Especially MA7, which has accurately suppressed every attempt to rebound in the candlesticks. As long as the 4-hour closing price cannot stay above MA7, any intraday rebound should be viewed as a 'Dead Cat Bounce'.
Volume-Price Divergence: Pay attention to the recent bearish candlesticks; although the price has hit a new low, the trading volume compared to previous highs has shrunk. This may indicate a slight weakening of bearish momentum or that bulls have completely given up resistance (declining on low volume is the most terrifying).
Weak Consolidation: A few small doji candles have appeared around the price of $0.0169, but this is not a signal of a bottom, more like a 'refueling station' in the downtrend.
3. Upcoming Trend Forecast
Overall Tone: The downtrend continues, with a long road to find a bottom. Do not blindly guess the bottom before a significant reversal candlestick appears.
Scenario One: Inertia Downward, Testing New Lows (Probability 60%)
Logic: Once a trend is formed, it will not change easily. Currently, there are no indicators showing a bottom structure.
Trend: After a brief resistance, the price effectively broke below $0.0165, triggering a new round of stop-loss orders, quickly plunging to the $0.0150 - $0.0155 range.
Operation Suggestion: Go with the trend, and avoid catching falling knives against the trend. Short holders can continue to hold until a strong bullish candlestick appears.
Scenario Two: Oversold Rebound, Testing Moving Averages (Probability 30%)
Logic: Due to the significant short-term decline and high deviation rate, combined with a negative funding rate, it may trigger robots to buy on the oversold rebound.
Trend: The price suddenly surged, touching the 4-hour level MA7 ($0.0181) or even MA25 ($0.020), completing a 'pullback confirmation' on the moving averages, then faced resistance again and fell back.
Operation Suggestion: This is an opportunity for those trapped to reduce their positions and escape, as well as a window for aggressive short-term traders to bet on a rebound, but the risk-reward ratio is extremely poor.
Scenario Three: Rate Squeeze, Violent V-Rebound (Probability 10%)
Logic: If the funding rate rapidly expands to -0.1% or lower, the main force may take advantage of borrowing costs to reverse harvest overly crowded shorts.
Trend: A massive bullish candlestick with a long lower shadow has appeared, with a single-day increase exceeding 20%, directly reclaiming the $0.020 level.
Operation Suggestion: Only consider this scenario when an abnormal funding rate is observed.
4. Operation Suggestion
"Do not catch falling knives, do not guess the bottom, only trade the right side."
Watch the lifeline at $0.0181: This is the MA7 resistance level on the 4-hour chart. Only when the 4-hour candlestick closes strongly above $0.0181 can it be considered a short-term bottom; otherwise, all rises are a trap.
Key Defense: If holding spot or long positions, $0.0165 is the last psychological defense line. Breaking this level means the potential for a bottomless decline is opened.
Short Strategy: When the price rebounds and encounters resistance around $0.0178 - $0.0180, it is a relatively good entry point for short positions, with a stop-loss set at $0.0185.
Beware of Downtrends: This formation is most afraid of 'dull knives cutting meat'—falling 5%-10% daily, not giving a quick end, slowly exhausting the bulls' margin. For such trends, cash is king is the best strategy.
Disclaimer: The cryptocurrency market, especially altcoin contracts, is highly volatile. This analysis is for reference only and does not constitute investment advice.
