Based on the 4-hour candlestick chart, daily chart, global liquidation data, and BTC market trends, combined with the current funding rate of 0.005%, the following is an analysis of the trend of $Binance Life (hereinafter referred to as this token).
1. Market Background and Sentiment Analysis
The current trend of $Binance Life is in an extremely divided macro environment, showing characteristics of being 'the resilient anomaly in a market crash.'
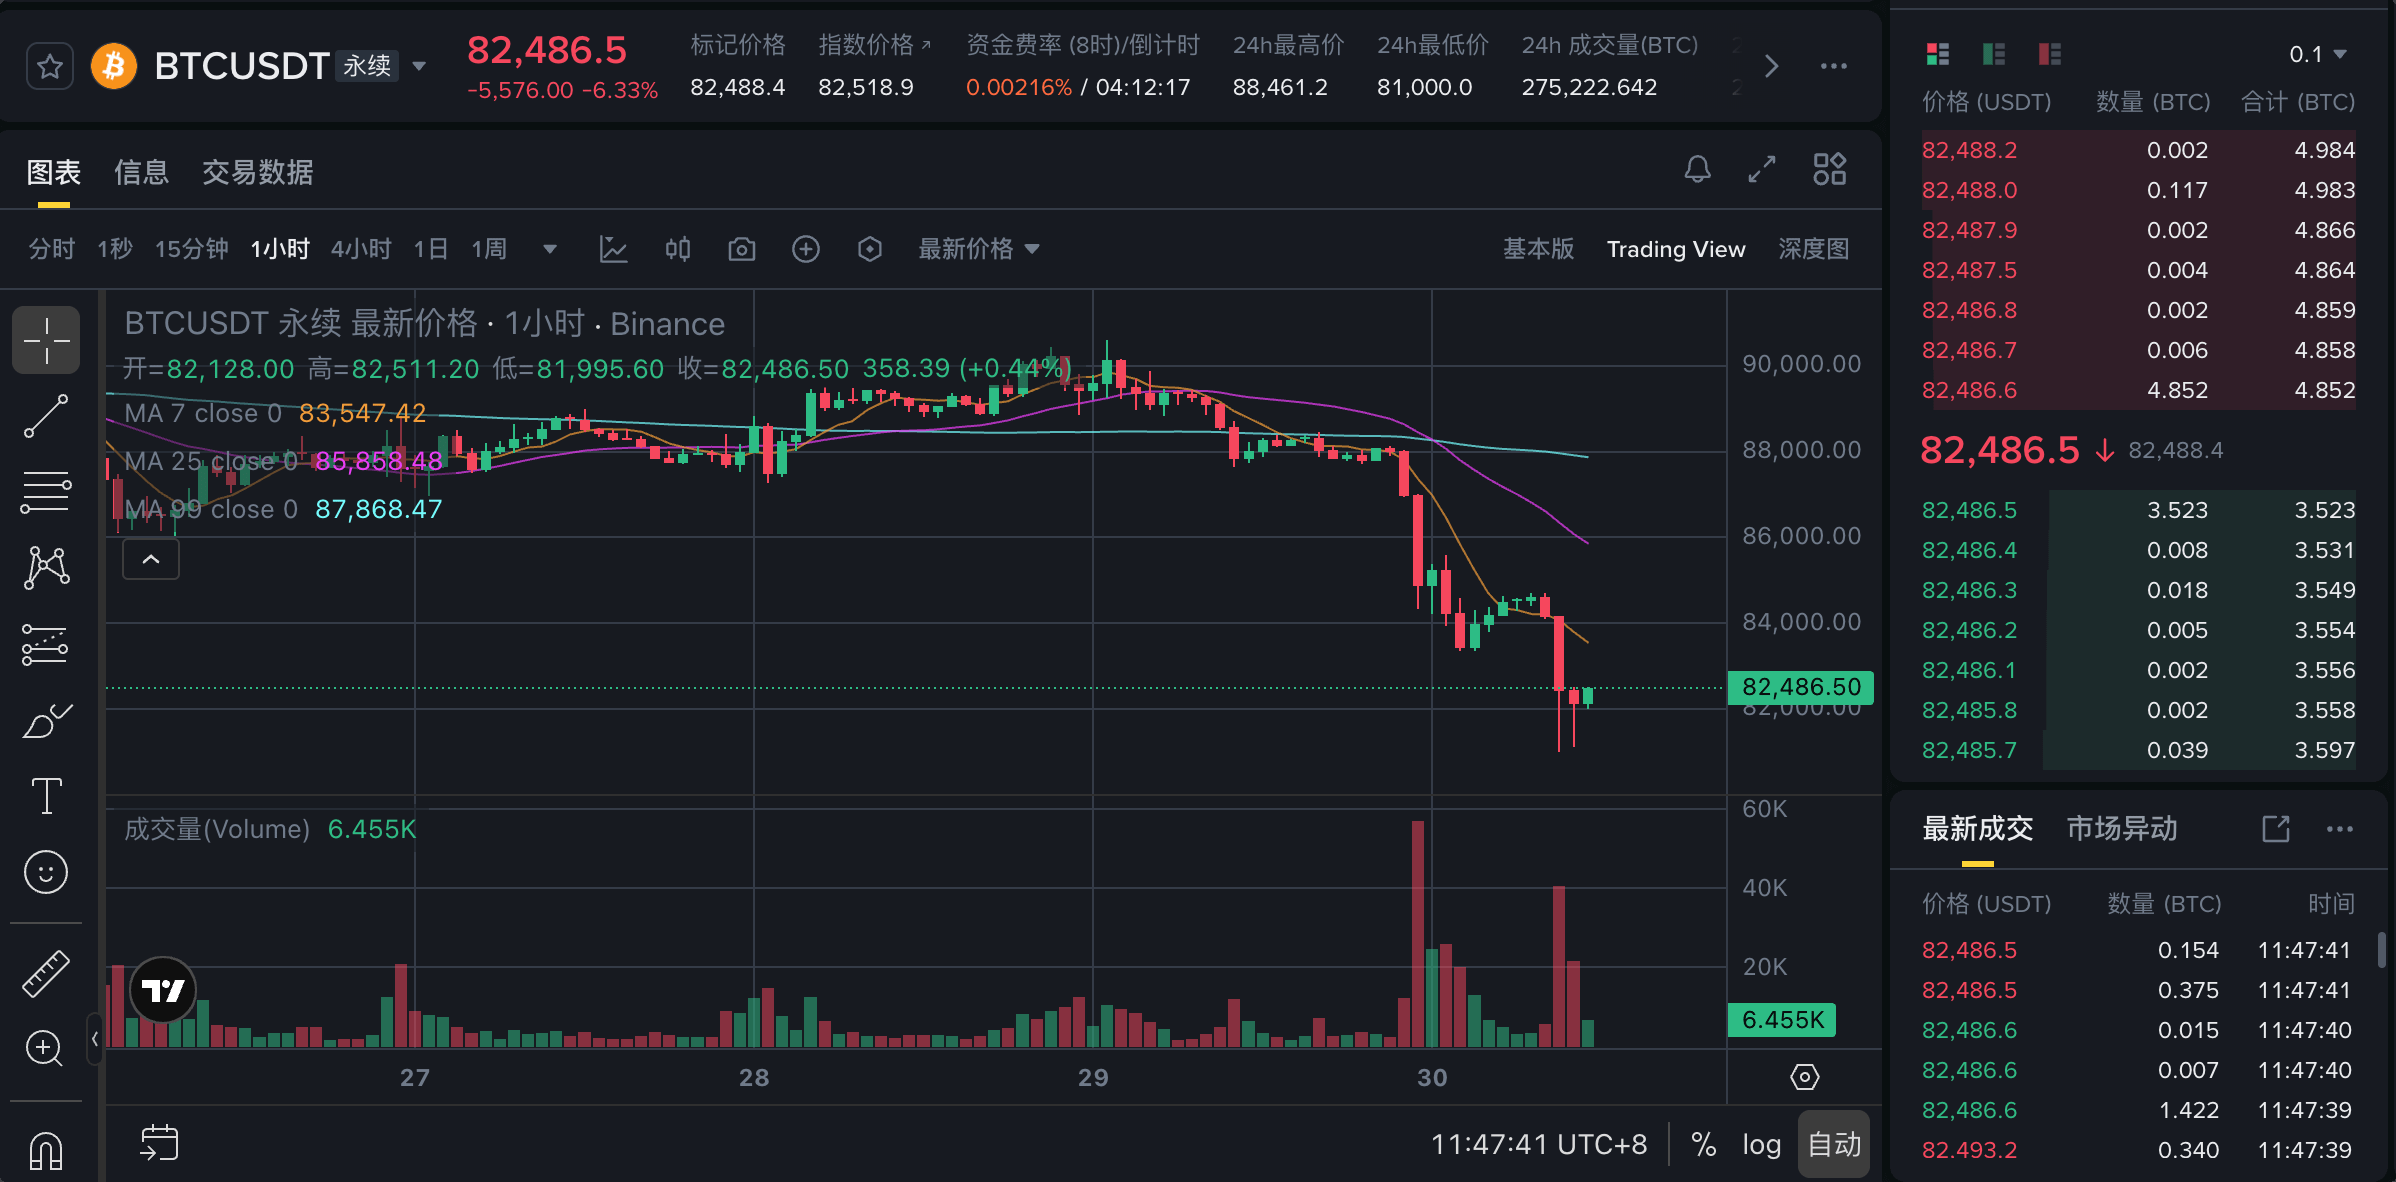
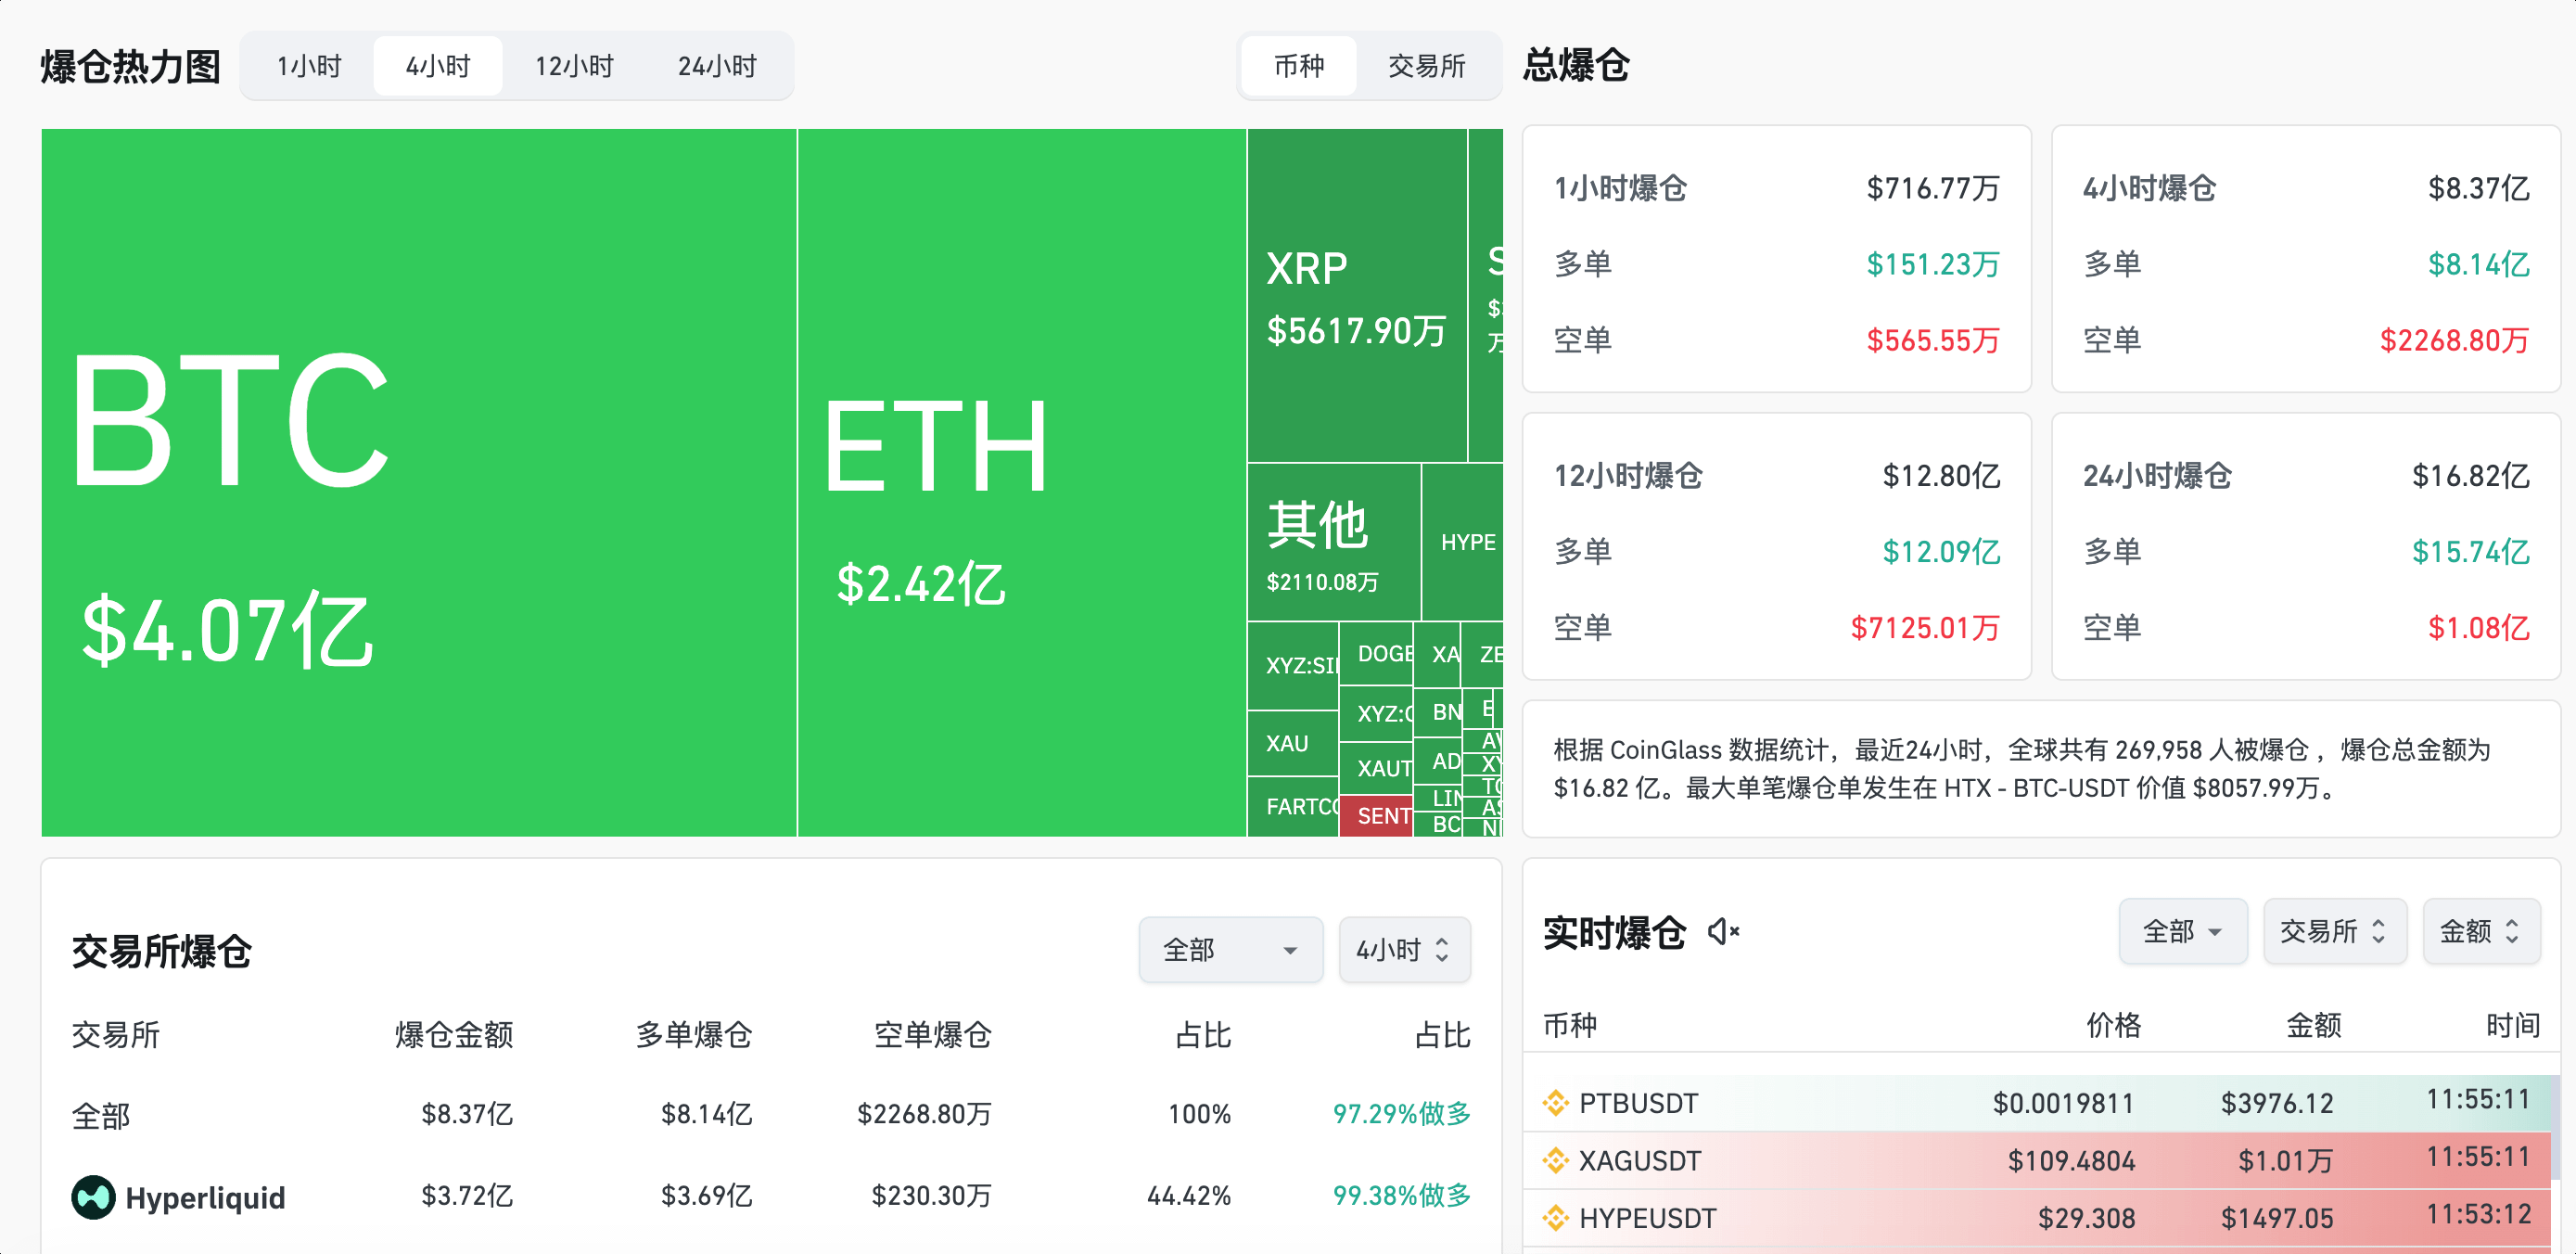
Extreme fear transmission in the market: From the liquidation heat map, it can be seen that the total liquidation amount in the past 4 hours reached $837 million, with long positions liquidating at $814 million, accounting for as much as 97.29%. BTC fell over 6% in a single day, breaking through the $83,000 mark. In such an extreme 'bull slaughter' market, most altcoins typically follow the market with a decline of 10%-20%.
Abnormal Relative Strength: However, observing the daily chart of this token, it recorded a +4.91% increase today (despite a slight drop in the 4-hour level), and the price remains above 0.155. This phenomenon of 'not falling when it should' during a BTC crash usually indicates two points:
Strong Institutional Control: Main funds are supporting the market, unwilling to let chips flow out cheaply.
Fund Risk Aversion: Some in-market funds, during the drastic decline of the market, chose coins that have recently been popular or have light trading to engage in short-term speculation.
Neutral Implication of Funding Rate: The current contract funding rate is 0.005%, in an extremely weak positive rate state. This indicates that although the trend is relatively resilient, there is no excessive FOMO (fear of missing out) in the market, and both long and short positions are cautious at the current level, with no large-scale borrowing behavior.
2. Technical Analysis
Daily Chart: Difficult bottoming under moving average pressure
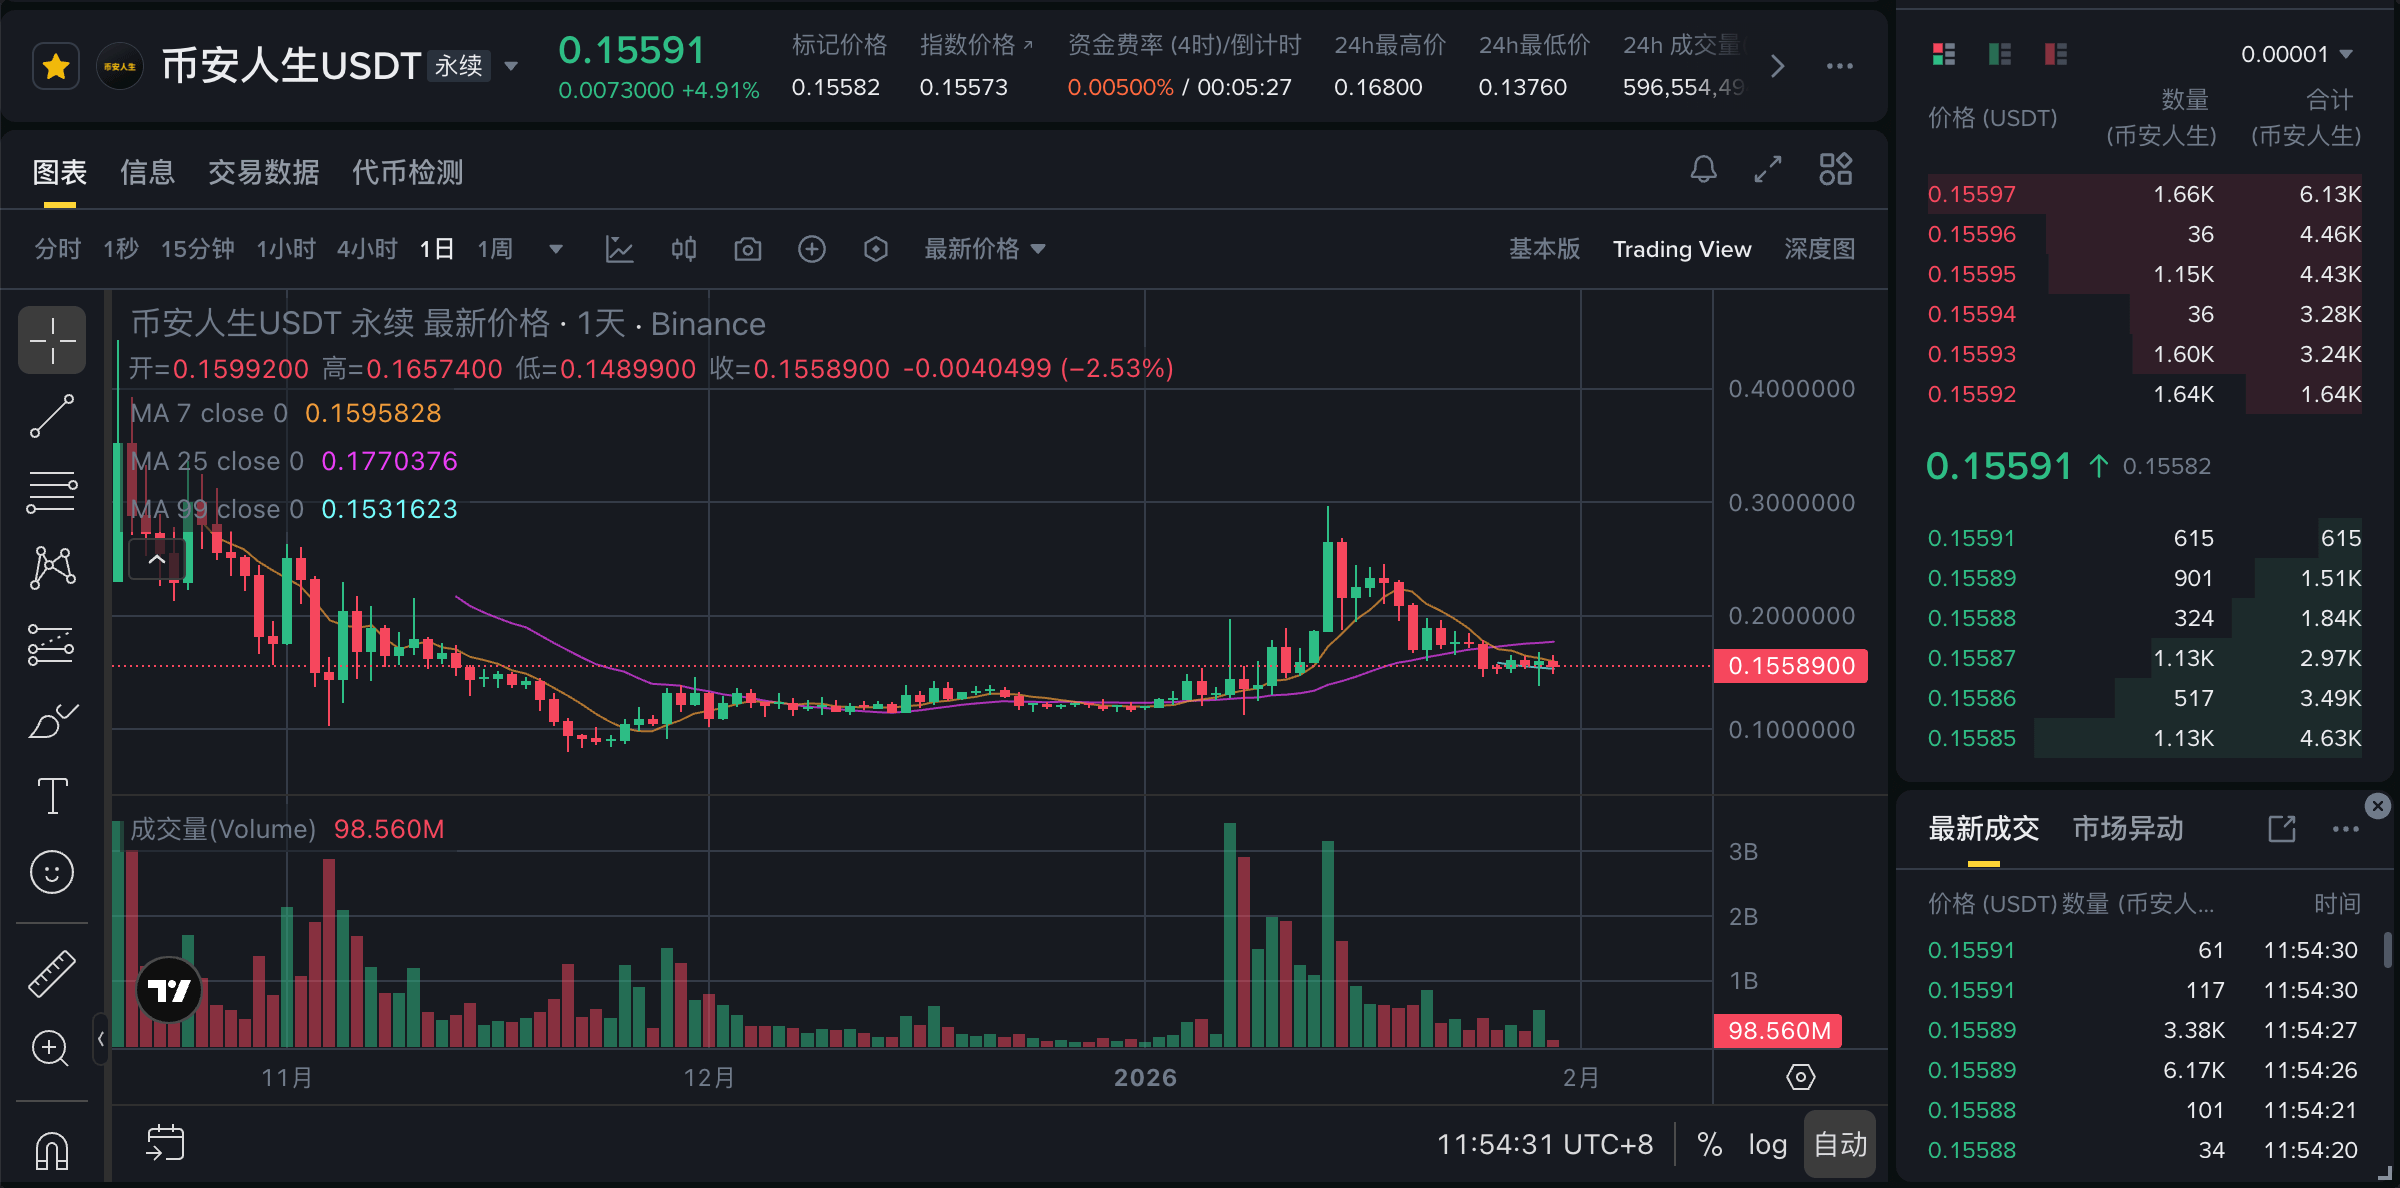
Moving Average Bearish Alignment: The daily chart shows that MA7 ($0.1595) has crossed below MA25 ($0.1770), forming a death cross. The current price of $0.1559 is still constrained by the short-term resistance of MA7. As long as it cannot effectively stabilize above MA7, the overall trend remains weak.
Support Logic of the Lower Shadow: The candlestick leaves a lower shadow, and multiple rebounds occur near the low of $0.1489. This forms a short-term iron bottom. In such a harsh market environment, the support level has not been broken, validating the strength of buying pressure below.
4-hour Chart: Box range oscillation and directional choice.
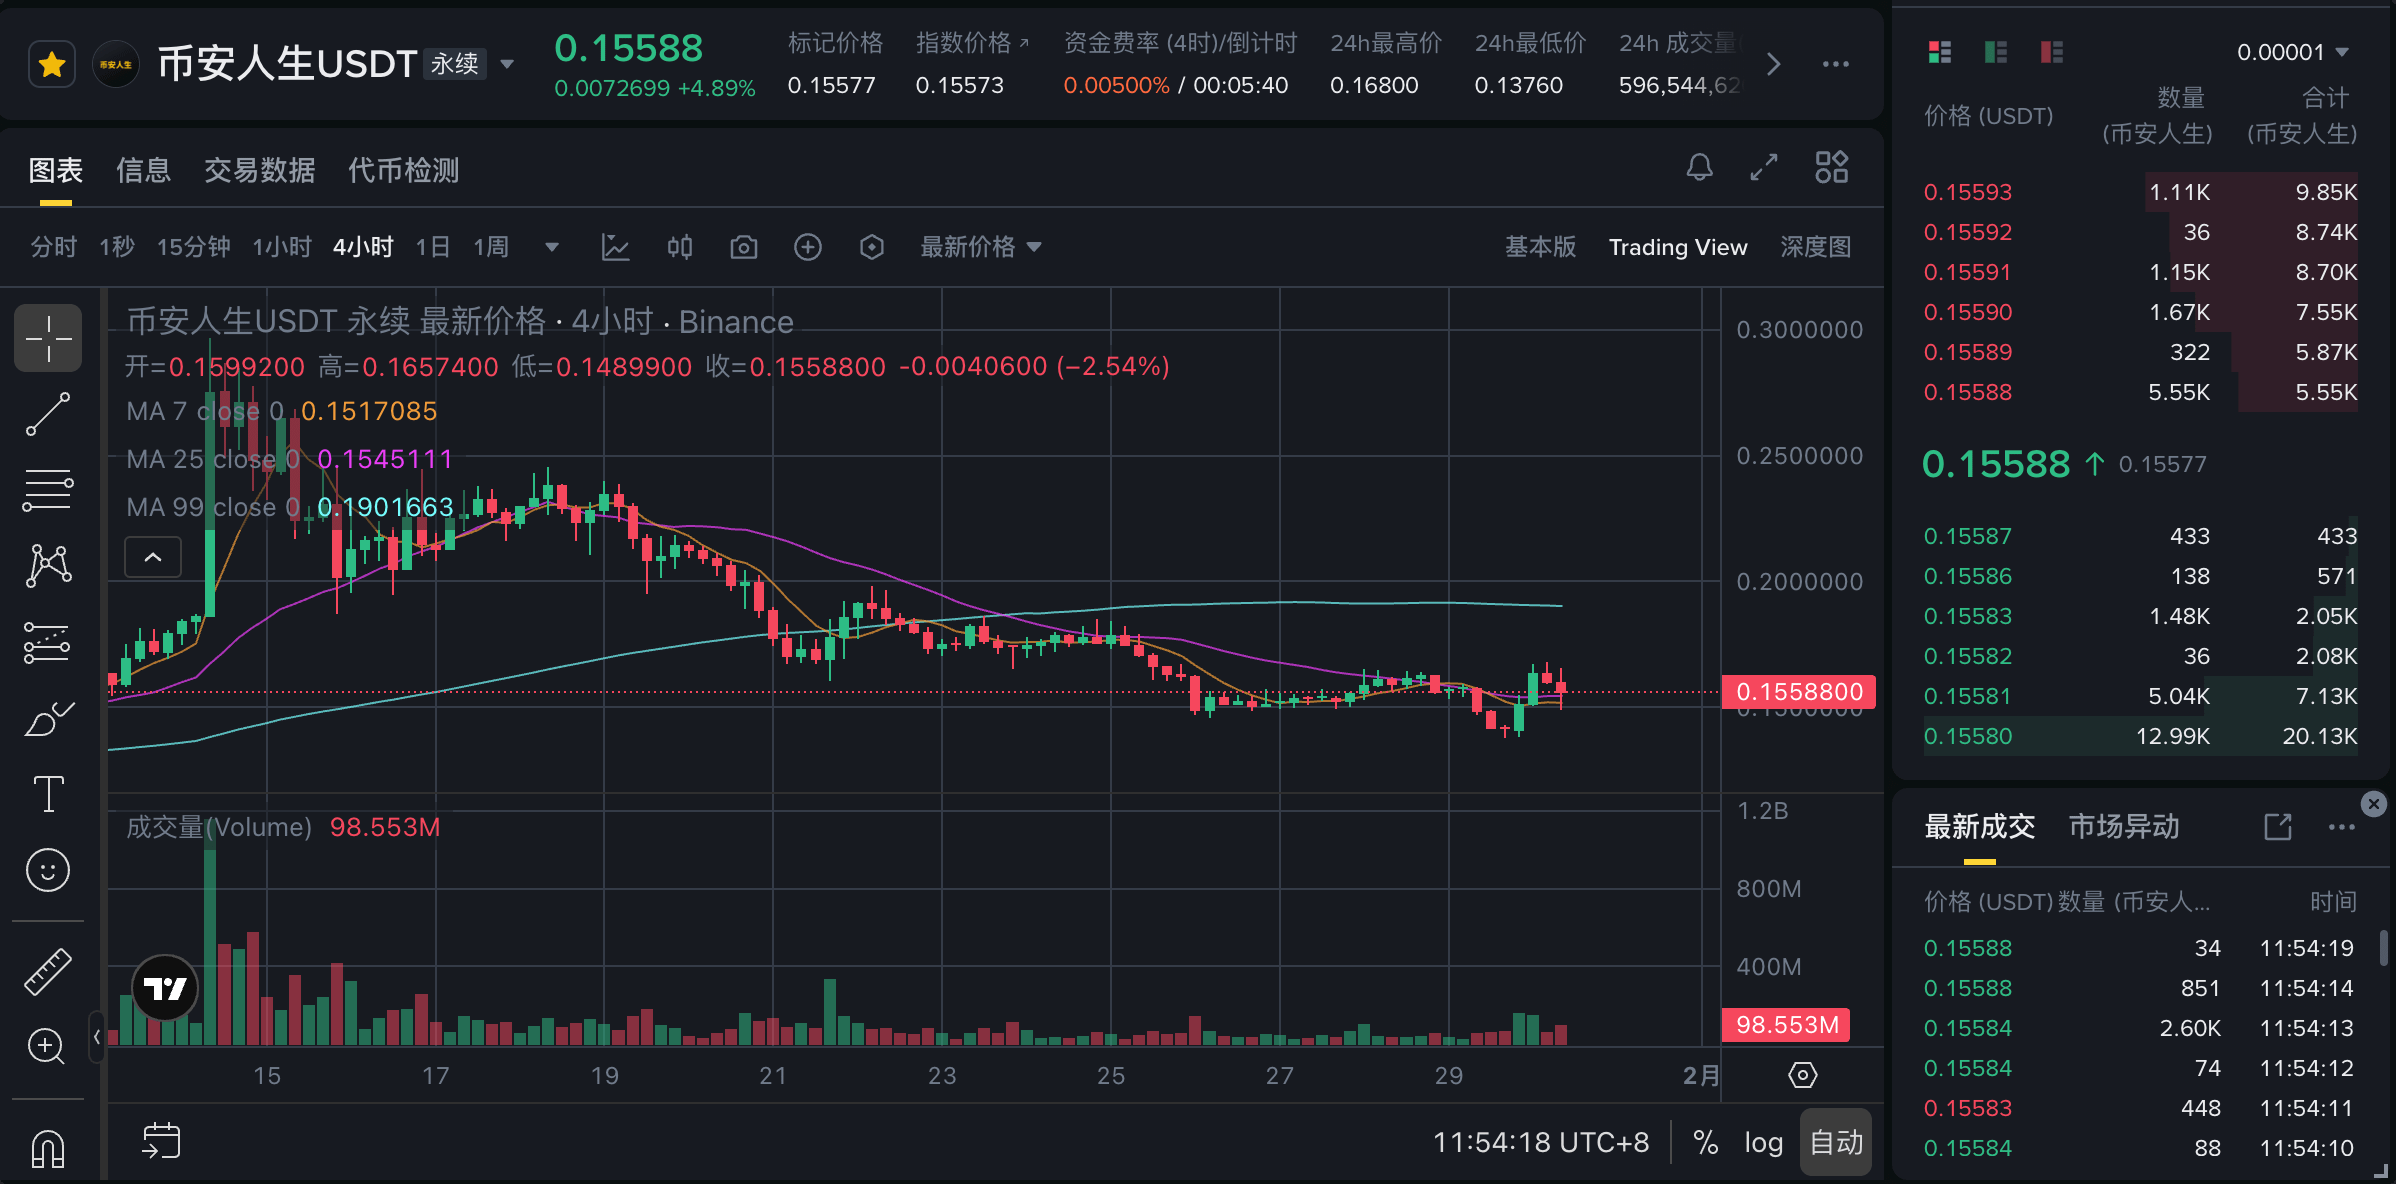
Narrow Volume Reduction: At the 4-hour level, the price oscillates in the narrow range of $0.150 - $0.160. Compared to the violent fluctuations on the left, the current trading volume (Volume) has significantly shrunk. Volume reduction usually indicates a potential change in trend.
Moving Average Entanglement: MA7, MA25, and the price line are entangled, leading to unclear direction. It is worth noting that although BTC has produced a massive bearish candle, the 4-hour K-line of this token has not shown a destructive long bearish candle but has instead oscillated in a fragmented manner, demonstrating strong resilience.
3. Upcoming Trend Prediction
Overall Tone: The sustainability of independent market conditions is in doubt, and the short-term focus is on whether the market can stop falling. If the market stabilizes, this token is expected to lead the rise; if the market continues to decline sharply, the risk of catching up increases.
Scenario One: The market stabilizes, and the resilient turn leads the rise (probability 45%)
Logic: The market has the law of 'the strong get stronger.' If BTC stabilizes around $82,000, funds will preferentially flow back into coins with significant resilience. This token, having shown strong support during a sharp decline, will be regarded as a strong target.
Trend: The price breaks through MA7 resistance ($0.160) with volume and subsequently hits a high of $0.1657 from four hours ago. Once it stabilizes above $0.165, it will initiate a rebound towards daily MA25 ($0.177).
Operation Suggestion: Pay attention to the breakout situation at $0.160; a right-side breakout can be followed with a light position.
Scenario Two: Catch-up correction, testing previous lows (probability 35%)
Logic: Underneath the roof, there are no complete eggs. If BTC further breaks through the $80,000 barrier, market panic will escalate, and main funds may abandon the support, leading to a downward pressure to absorb positions, resulting in a 'catch-up' for this token.
Trend: Breaking below the short-term support of $0.148, quickly probing down to the previous dense trading area of $0.135 - $0.140 to find a new balance.
Operation Suggestion: If the 4-hour closing price falls below $0.148, long positions should decisively stop loss and exit to prevent deep entrapment.
Scenario Three: Ignoring the market, meme coins rise independently (probability 20%)
Logic: Considering that this token possesses some Meme or strong institutional attributes, the main players may use the market's drastic decline and lack of hot topics as a time window to pull against the trend, creating an eye-catching effect to induce shorts to be liquidated.
Trend: A massive long candlestick appears, directly lifting above $0.180, and the funding rate quickly spikes to negative (shorts are squeezed).
4. Operation Suggestion
Currently in the defensive counterattack phase of a 'headwind situation,' survival comes first, profit second.
Key Defensive Level $0.148: This is the lifeline for bulls. Considering the high volatility of the market, it is recommended to slightly widen the stop-loss level to around $0.145 to prevent spike losses. If this position is effectively broken, it means the logic of resilience is invalidated.
Left Side Ambush Strategy: Given its resilience, aggressive traders can attempt to take small positions to buy in the range of $0.150 - $0.152, aiming for excess returns (Beta returns) during the market rebound.
Pay Attention to Market Linkage: Although the current trend is relatively independent, it is essential to keep a close eye on BTC's movements. If BTC experiences a rapid decline, any technical support may instantly fail.
Rate Monitoring: The current rate of 0.005% has no reference significance. If the price rises while the rate quickly turns negative (e.g., below -0.05%), it signals a short squeeze from the main players, which can be followed by long positions; if the rate surges to a high positive level, caution is needed to avoid being lured into a selling position.
Disclaimer: The cryptocurrency market is highly risky, especially for such highly volatile tokens. This analysis is based on existing candlestick patterns and data and does not constitute any investment advice.