Recently, many new fans watching my live stream often do not understand some of the technical terms I use during the broadcast. I specifically wrote an article to popularize this for everyone.
When you look at the fluctuating candlestick chart, seasoned traders often say 'there is a divergence here' or 'oversold will rebound'. Doesn't it feel like listening to a foreign language? Understanding these terms will help you start to hear the 'whispers' of the market.
1. The 'thermometer' of market status: Overbought and Oversold
This is the most basic concept for judging the 'heat' of the market.
Overbought:
What it is: When prices rise too sharply and too quickly in a short period, it is like a person overheating after intense exercise, needing to rest and cool down. Market sentiment is too enthusiastic, buying power is exhausted, and the probability of a correction increases.
For beginners: 'Bought too much, it’s time to rest.' Usually appears after a series of significant rises.
Common indicators: RSI (Relative Strength Index). When RSI is above 70 (or 80), it enters the overbought zone.
Oversold:
What it is: When prices drop too steeply and too quickly in a short period, it's like a person shaking from the cold, with a dangerously low body temperature. The market falls into panic, and selling power is concentrated and released, increasing the probability of a rebound.
For beginners: 'Sold too much, it’s time to recover losses.' Usually appears after a series of significant drops.
Common indicators: RSI. When RSI is below 30 (or 20), it enters the oversold zone.
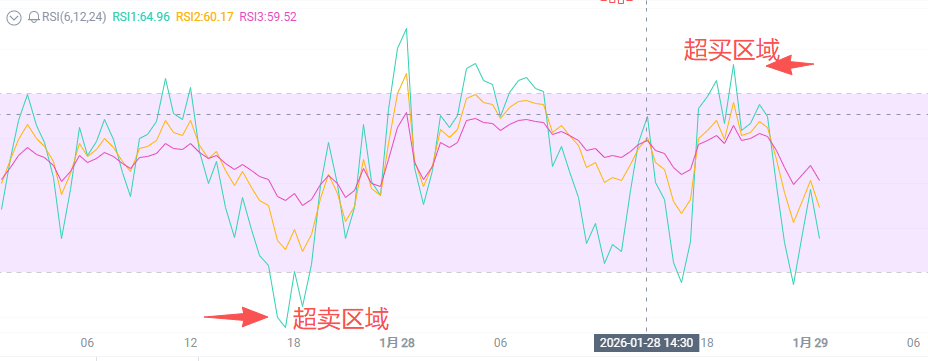
Important note: Overbought does not mean it will drop immediately, and oversold does not mean it will rise immediately. In extreme bull or bear markets, prices may remain in the overbought/oversold zone for a long time. It is merely a 'warning signal', indicating that the market is currently 'overheated' or 'overcooled'.
Two, a strong 'reversal warning signal': divergence
This is a heavyweight signal in technical analysis, often indicating that the trend may be about to turn.
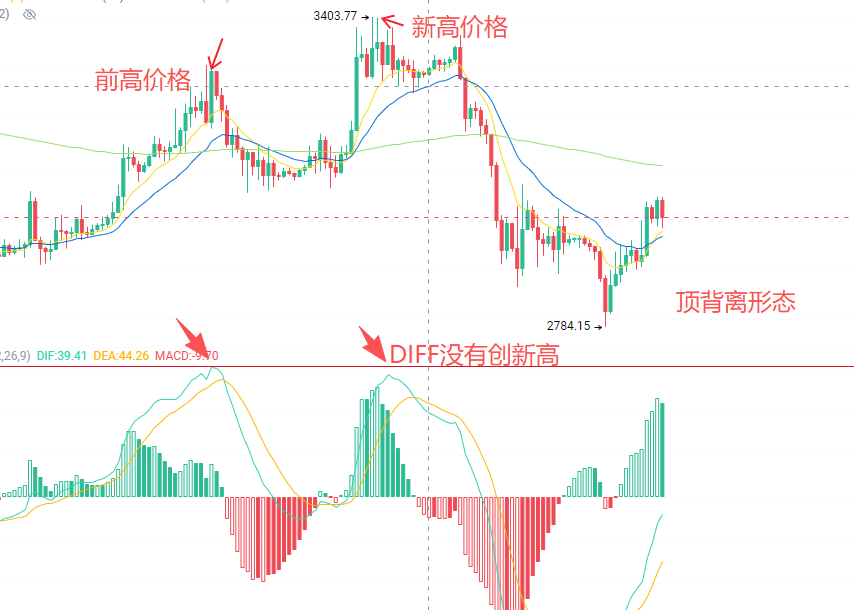
Top Divergence (Bearish Divergence):
Occurrence scenario: During the process of prices reaching new highs.
Phenomenon: Prices are making higher highs, but the corresponding momentum indicators (such as MACD or RSI) are making lower highs.
For beginners: 'Prices are making new highs, but the internal upward momentum is not keeping up, like a car with the accelerator pressed to the floor but starting to slow down.' This indicates that the upward trend may be exhausting, signaling a potential downward reversal.
Memory Mnemonic: 'Price rises, volume (momentum) decreases, trend may change.'
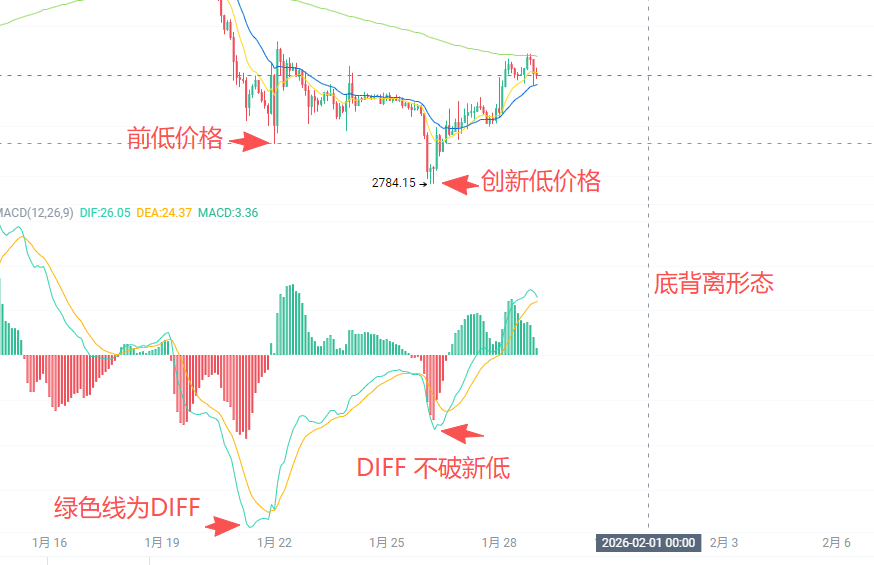
Bottom Divergence (Bullish Divergence):
Occurrence scenario: During the process of prices reaching new lows.
Phenomenon: Prices are making lower highs, but the corresponding momentum indicators (such as MACD or RSI) are making higher highs.
For beginners: 'Prices are making new lows, but the internal downward momentum is already insufficient, like a car with the brakes pressed to the floor but unable to stop.' This indicates that the downward trend may be exhausting, signaling a potential upward rebound.
Memory Mnemonic: 'Price drops, volume (momentum) increases, rebound is near.'
Three, the key 'Decision Moment': Trend reversal signal
'Trend reversal' refers to an impending change in the direction of price movement. Besides 'divergence', there are several classic patterns:
Support and Resistance:
Support: When prices drop, they may encounter a 'floor' that is difficult to break through. It often rebounds multiple times.
Pressure: When prices rise, there may be a 'ceiling' that is difficult to break through. It often falls back multiple times.
Trend reversal moment: When prices effectively break through resistance, that resistance may become new support; when prices effectively break below support, that support may become new resistance. This is 'trend reversal'.
Trading Volume:
Core principle: Rising volume and price is a healthy uptrend; volume-price divergence (price rising while volume decreasing) is a dangerous signal.
Trend Reversal Signal:
If prices consolidate at key positions (support/resistance) and are accompanied by a sharp increase in trading volume during the breakout, then this trend reversal signal is more reliable.
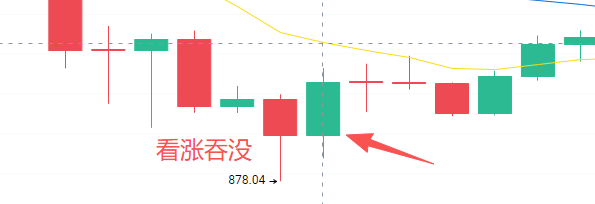
Classic Candlestick Patterns:
Bullish Engulfing: After a significant drop, a large bullish candle completely 'eats' the previous day's bearish candle, suggesting a bullish counterattack.
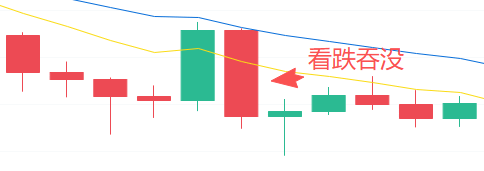
Bearish Engulfing: After a significant rise, a large bearish candle completely 'eats' the previous day's bullish candle, suggesting a bearish attack.
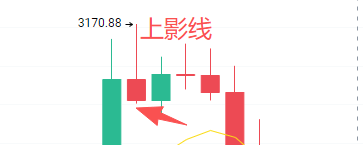
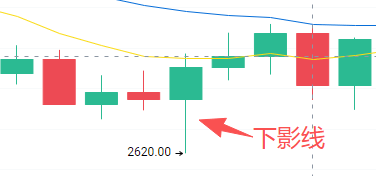
Hammer Line/Hanging Line: A small candlestick with a long lower shadow, called a 'Hammer' when it appears at the bottom (indicating a potential bottom), and a 'Hanging Line' when it appears at the top (indicating a potential top).
Core advice for beginners
1. Don't blindly trust a single signal: Don't jump to short your entire position just because you see a 'top divergence' or 'overbought' signal. The market is complex and requires multiple signals to resonate (for example: appearance of a top divergence + reaching a strong resistance level + candlestick showing a bearish pattern) to be more reliable.
2. Use in combination: Combine 'overbought and oversold' (to judge the state) with 'divergence' (to judge momentum). For example, when a top divergence occurs in the overbought zone, its warning significance is much stronger than simply being overbought.
3. Always set stop-loss orders: Technical analysis is a probability game, with no guarantees. Any signal can fail, so you must set stop-loss orders when placing trades to protect against erroneous judgments.
4. Observe first, then practice: Open historical candlestick charts to verify the trends after these terms appear, and develop a 'market feel'. Before trading with real money, try using a demo account or very small funds first.
Understanding these terms is the first step from 'trading based on feelings' to 'planned trading'. They are tools for observing the market, but remember, the market is always right, and tools can be wrong. Stay humble and proceed with caution.
Alright, now that you've reached this point, you are no longer that complete novice who was confused upon entering the group.
From the confusing 'black talk', to the extremely dangerous 'contract play', and now to these technical signals that penetrate candlestick fluctuations, these three steps that Big Brother has walked with you can be considered as handing you a map and lighting a lamp.
Remember, these things are tools for understanding what others are doing, not guarantees that you can predict what tomorrow will be like. A day in the crypto world is like a year in the human world; behind the excitement lies all the risks.
The most important thing is to say it three times:
Use spare money, don't get carried away!
First simulate, then trade with real money!
Contract leverage, beginners should not touch!
The journey is long, let's improve together. If you have any questions or see any new terms, feel free to come back to Big Brother.
I'm Big Brother, see you next time.
(If you find this useful, share it with that friend who is still asking 'What is MACD?').