Eleven years ago, with the naive hope of 'taking a chance to turn a bicycle into a motorcycle,' I stepped into this 24/7 non-stop crypto world. I once rejoiced at a 50% increase in a single day and also experienced the despair of losing it all overnight.
Eleven years, a whole era. I have witnessed several 'deaths' of Bitcoin and experienced the madness of DeFi Summer and NFTs.
Today, when the numbers in my account broke the eight-digit mark, what I wanted to say the most was not 'how much I earned,' but 'I survived.' Over these eleven years, the tuition I've paid has exceeded tens of millions. Now, it's time to share these valuable insights worth '80 million' without reservation with all of you who have always supported me.
This is not a wealth code but a 'survival guide'.
Let's talk about the technical form of VCP today!
Volatility contraction pattern (VCP) trading strategy guide: how to identify 'smart money' accumulation and enter precisely before the breakout!
VCP is a core trading strategy popularized by the famous American trader Mark Minervini, author of (Think and Trade Like a Champion). It is considered one of the most reliable technical patterns to identify and participate in price breakouts.
In this article, we will explain the volatility contraction pattern (VCP) trading strategy—how to identify and trade the VCP pattern, illustrated with examples. Please read our previous articles, where we introduced the Darvas Box trading strategy—a trend-following trading strategy and its case analysis.
What is the volatility contraction pattern (VCP)?
The volatility contraction pattern (VCP) is a trading pattern used by Wall Street's top trader Mark Minervini to identify potential breakout opportunities.
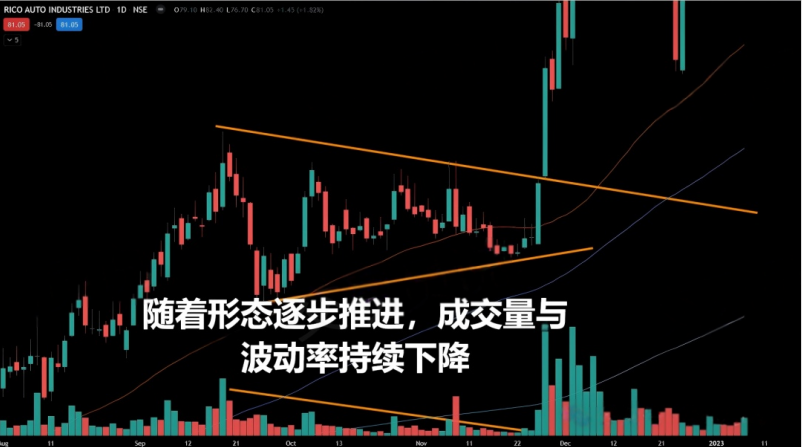
In his bestselling book (Think and Trade Like a Champion), Mark Minervini points out that when price volatility and trading volume decline simultaneously, the VCP pattern forms. He refers to this state as the 'line of least resistance.' When prices break out above this pattern, it often indicates that a favorable buying opportunity is emerging.
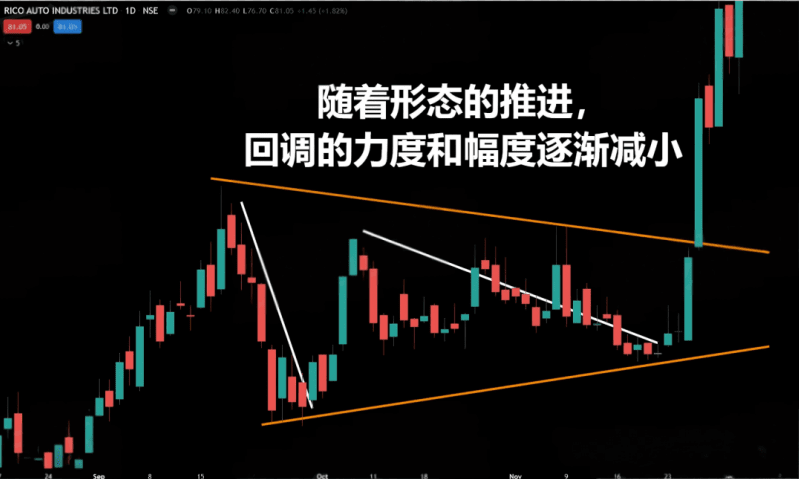
The core idea of VCP is that each price pullback will be smaller than the previous one, thereby tightening the price range continuously, reflecting that sellers are gradually losing interest. The contraction in volatility indicates that supply is running out, while demand may be accumulating secretly, creating conditions for the subsequent breakout. Mark Minervini especially focuses on strong breakouts accompanied by increased volume, as these are often seen as signals of institutional funds' involvement, also indicating that stock prices are likely to continue their upward trend.
Key elements of VCP
Volatility contraction pattern (VCP) is a trading pattern that shows the price range of stocks tightening gradually before a potential breakout. This pattern has several key characteristics:
✍ Price contraction: In VCP, each price pullback will be smaller than the previous one, forming increasingly tighter price ranges over time. For example, the first pullback may be 25%, the next 15%, and the last 8%. This gradually shrinking pullback pattern indicates that selling pressure is weakening.
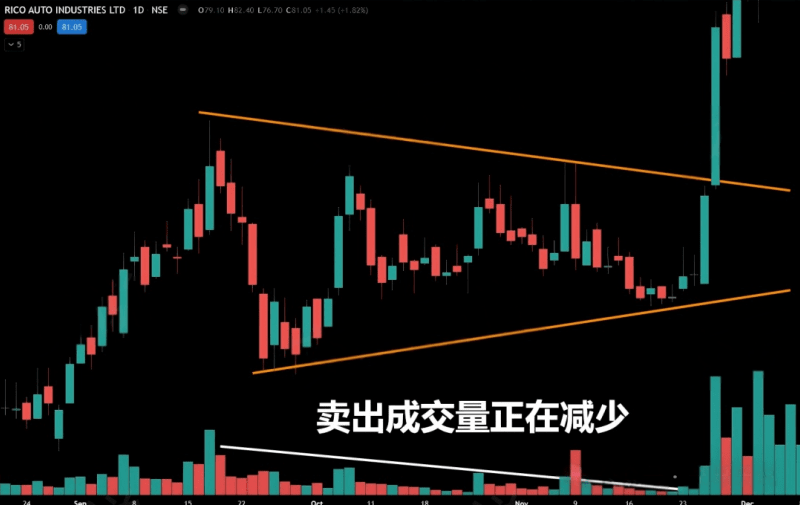
✍ Volume decrease: Each time the price contracts, accompanied by a decrease in volume, indicates that active sellers are reducing. This decrease in volume suggests that supply is depleting, preparing for the subsequent upward trend.
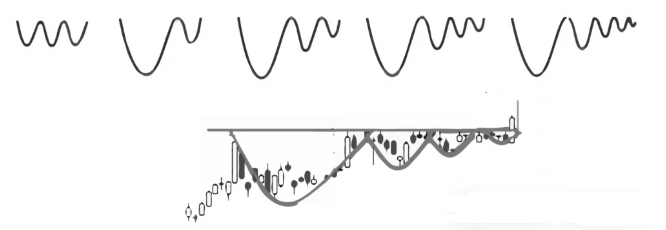
✍ Symmetry and structure: VCP usually contains 2 to 6 contractions, with each contraction being smaller than the previous one, forming a symmetrical tightening 'bottom' from left to right. This orderly structure often indicates that strong investors are gradually accumulating shares.
✍ Low supply at the pivot point: When VCP reaches the pivot point, prices are the most contracted, and trading volume is extremely low. If a breakout occurs at this position with increased volume, it typically triggers a strong upward trend.
✍ Trend continuation: VCP typically appears in an upward trend, acting as a continuation pattern. When positions are already on the rise, VCP forms a pause in the upward movement, accumulating momentum for the next wave of increases.
These characteristics make VCP a strong reference for traders to enter before a breakout, increasing the success probability of capturing the next significant rally.
Success rate of VCP
The volatility contraction pattern (VCP) has a high success rate, especially in strong markets. Studies show that when VCP breakouts are accompanied by strong volume, about 60%–70% of the breakouts lead to robust price increases.
This consistency makes VCP a popular choice among traders, especially in bull markets, where institutional buying drives prices higher. When volume confirms the breakout, it indicates that demand has surpassed supply—this is an important signal of market strength. Traders trust VCP because it is usually accompanied by reliable follow-up gains, and if timed correctly, can yield substantial profits.
A strong VCP breakout is usually accompanied by a surge in trading volume of 30%–40% on the breakout day. This increase in volume shows that both large institutions and individual traders are supporting this trend, providing it with sustained momentum. High-volume breakouts typically lead to price increases of 20%–100% over the next few months.
For traders, volume is a key signal that helps confirm whether demand is genuinely strong or whether a breakout might fail. By focusing on volume, you can identify breakouts that have real sustainability while avoiding weaker trading opportunities.
VCP trading strategy
The volatility contraction pattern (VCP) is applicable for both intraday trading and swing trading.
Its advantages mainly include:
❍ During low volatility phases, stop-loss orders can usually be set tighter.
❍ Better risk-reward ratio
❍ Before the breakout, pay attention to whether higher lows have occurred.
❍ Due to the tightening range of price fluctuations from highs to lows, the stop-loss space is smaller.
In short: the more 'congested' the prices are, the more powerful the breakout tends to be—while the risks you bear are lower. For traders, this is a 'good deal'.
Re-accumulation in the second phase of the upward trend (volatility contraction breakout) VCP pattern determination standards.
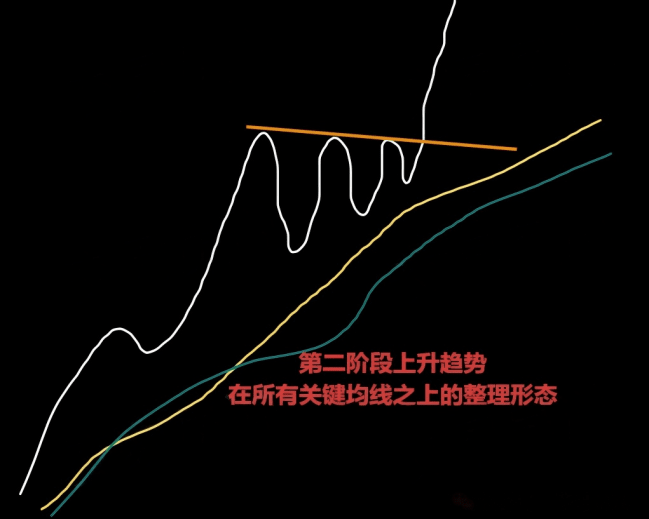
1. Stocks must be in the second phase of an upward trend and have entered overbought or oversold territory before the pattern forms.
2. Prices need to undergo a period of horizontal consolidation above all key moving averages.
3. As the pattern moves from left to right, the volume should gradually shrink.
4. Before the breakout, signs of 'smart money' (institutional funds) activity should be observable in the pattern.
5. Volume breakout is an important confirmation signal for the pattern's validity.
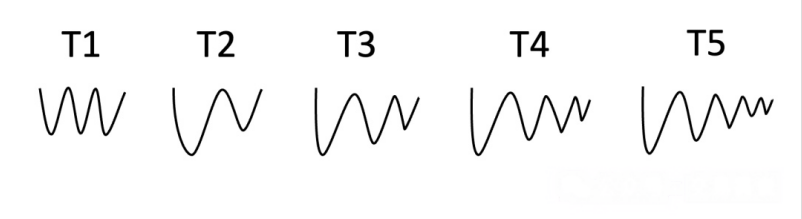
6. Different types of VCP patterns
Prices must be in the second phase of an upward trend and have experienced overbought or oversold states prior to the formation of the VCP pattern.
The core premise for the establishment of the VCP pattern: there must be demand.
✔ To form a standard, tradable VCP pattern, there must be real and sustained demand in the market.
✔ Demand signifies clean, strong upward momentum.
How to identify the second phase of the upward trend?
The simplest and most intuitive way to identify the second phase of the upward trend:
✔ Strong impulse market (appearing overbought)
✔ Prices are above all key moving averages.
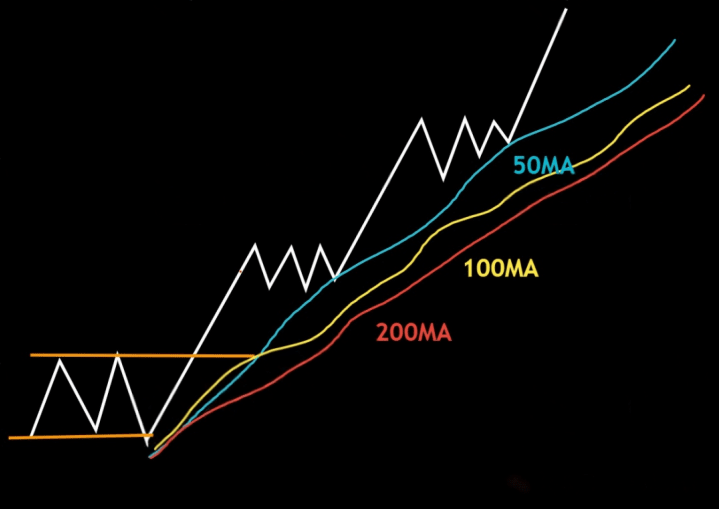
As shown in the image above, prices are in the second phase of an upward trend and are consolidating above key moving averages.
Two types in the first phase
○ Accumulation after the decline.
○ Re-accumulation in the second phase of the upward trend.
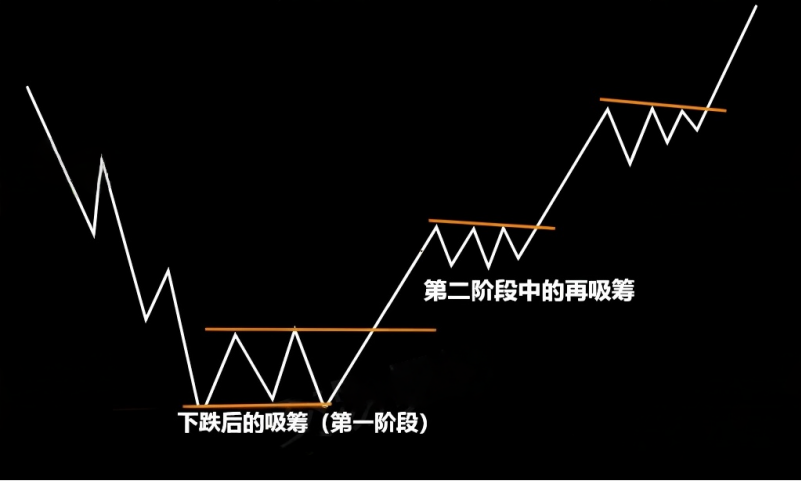
Phase One (Accumulation Phase): After a downtrend ends, prices begin to consolidate in a horizontal manner, followed by an upward breakout and continuation, eventually entering the second stage of an upward trend.
Phase Two (Re-accumulation): In the second phase of the upward trend, prices enter an overbought state and then consolidate horizontally above all key moving averages.
The market must experience a period of consolidation (volatility contraction).
What exactly happens during the consolidation period (the logic behind volatility contraction)?
Volatility contraction itself is a direct reflection of supply and demand dynamics, while also reflecting the psychological battle between smart money and retail investors (greed and fear).
1. When the price of the trading instrument reaches new highs and enters overbought territory, smart money begins to take profits, causing the price to enter a pullback. This pullback, like all other pullbacks in the market, is essentially caused by smart money realizing profits. When smart money exits, the price will move against the previous upward direction.
2. This decline will force many traders who chased high prices due to FOMO (fear of missing out) after the rise to be forced to stop loss or get trapped at high prices. These traders who bought at high prices begin to feel panic; once prices rebound close to their entry prices, they will rush to sell to limit losses.
3. As prices continue to fall, more and more traders begin to believe that this pullback is not just a pullback but a trend reversal. Thus, they start to build short positions, trying to capture what they believe will be a sustained downward trend.
4. Ultimately, prices fall to a key level where a large number of traders have established short positions. At this moment, smart money enters again, starting to build up long positions on a large scale.
5. They (smart money) are well aware that when their buy orders enter the market, prices will first rise slightly, which will cause those who are short to panic and be forced to cover their positions. The covering of shorts will further push prices up, amplifying the profits that smart money already holds.
6. This process of building positions—lifting prices—squeezing shorts—realizing profits will repeat until smart money has not only realized profits but also built a sufficient number of long positions.
7. Eventually, there will come a moment in the market: due to a large number of short sellers being forced to cover their positions at a loss, prices are pushed up, breaking through the highs of the pullback range. And when prices rise to this position, most traders who shorted during the pullback have already exited at a loss.
This is indeed the eve of the volatility contraction pattern's final explosion.
What should traders focus on during the price consolidation phase?
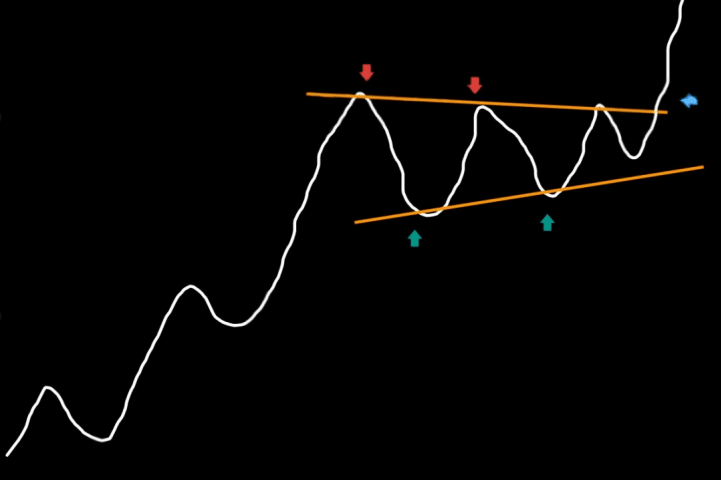
1. Prices must complete corrections through a series of increasingly smaller pullbacks. In other words, the magnitude of the decline from the highs should gradually narrow, and the price range between high and low should become tighter.
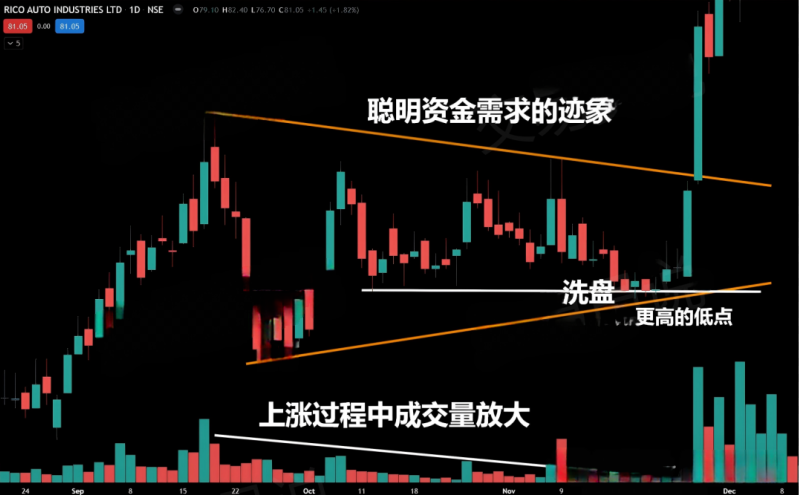
2. Forming higher lows (HL) before the breakout is a more ideal state.
3. As the pattern progresses from left to right, trading volume should gradually decrease.
4. Look for evidence of smart money demand within the consolidation range.
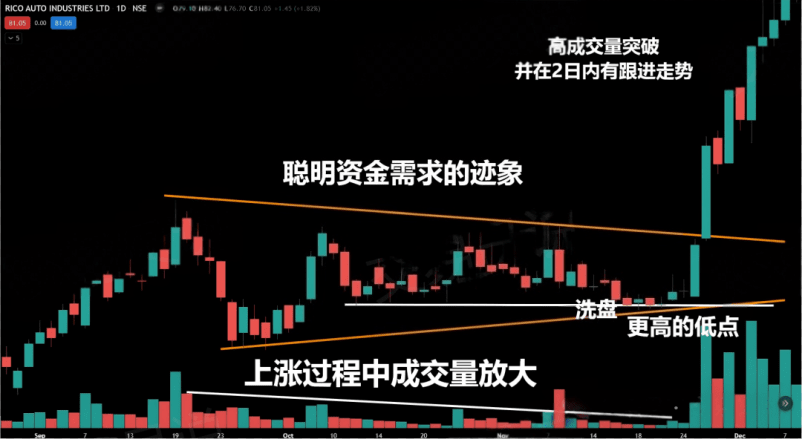
5. Breakouts must occur with increased volume.
Price corrections should be completed through multiple gradually converging small pullbacks.
1. Each time the price pulls back from a high point, the magnitude should be smaller than the previous pullback, representing that more and more weak positions in the market are being absorbed. The best pattern: higher lows appear before the breakout.
2. At least two pullbacks from the highs should be observed; the more pullbacks, the more mature and higher quality the pattern. These pullbacks themselves are the result of supply-demand dynamics and directly reflect the psychology and behavior patterns of smart money.
Common types of volatility contraction patterns (VCP)
❍ Triangle
❍ Range
❍ Tight Base / Flat Base
❍ Cup and Handle
❍ Flag
❍ Darvas Box
Volume must continue to shrink
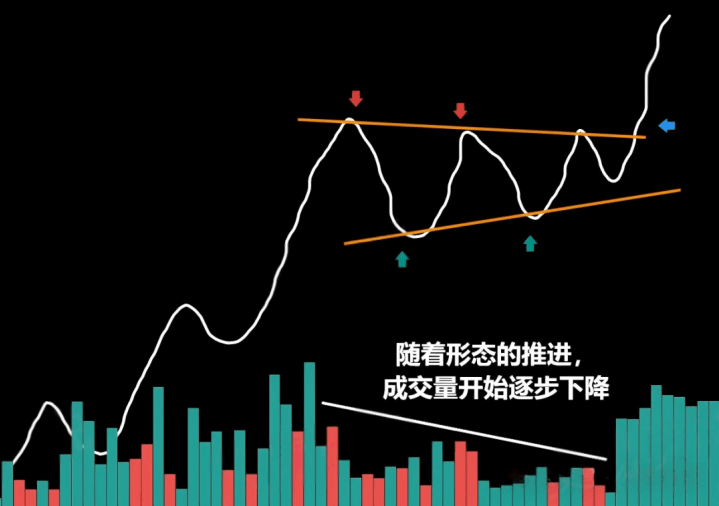
As the volatility contraction pattern progresses, the volume on the right side should decrease significantly. This indicates that the sellable shares in the market are being gradually absorbed, and once the supply is fully digested, stock prices can restart their upward trend.
In many cases, the trading volume of the last few days of the VCP pattern often approaches or even reaches the lowest level within the entire consolidation range.
Identify evidence of 'smart money demand' through pattern recognition.
❍ Bullish candlesticks continue to rise, while down days lack follow-through selling pressure. This usually occurs on the right side of the pattern or at the end of the pattern, which is the position before the breakout. This indicates that sellers are not applying selling pressure.
❍ Continuous volume increase. Observe a series of trading days where both price and volume increase. This usually represents that institutions are accumulating positions and clearing weak holdings (trapping low-buying investors when a downward breakout fails). These 'washout days' help eliminate weak holders in the market.
❍ Higher lows formed before the breakout.
Volatility contraction (VCP) breakout day
When demand begins to outstrip supply, it is clear that bulls will have the upper hand.
❍ The initial signal is a strong bullish candlestick with high volume.
❍ Price cleanly closes above previous highs/resistance levels.
Why do breakout bullish candlesticks accompany high volume?
❍ On the day of the breakout, buying pressure actively follows up, pushing prices higher.
❍ At the same time, short sellers face a dilemma: either cover their positions before losses worsen or add to their positions, hoping for a failed breakout.
❍ The combination of these two bullish forces creates a huge breakout volume.
Why does a breakout need to be followed up within two candlesticks?
❍ As the breakout occurs, short sellers' losses increase, especially those who added to their positions at the high of the previous candlestick. At this point, they have little choice but to cover. The covering of short positions further pushes stock prices up, enhancing the bullish momentum.
❍ Conservative buyers will buy above the high points of breakout candlesticks.
❍ These two bullish forces work together to facilitate the success of the breakout.
Summary
A high-quality VCP pattern typically takes 6 to 12 weeks to complete, during which the price will show 3-4 clearly distinguishable contractions. Such duration and structure often indicate that institutional funds are gradually accumulating, preparing for a higher probability breakout.
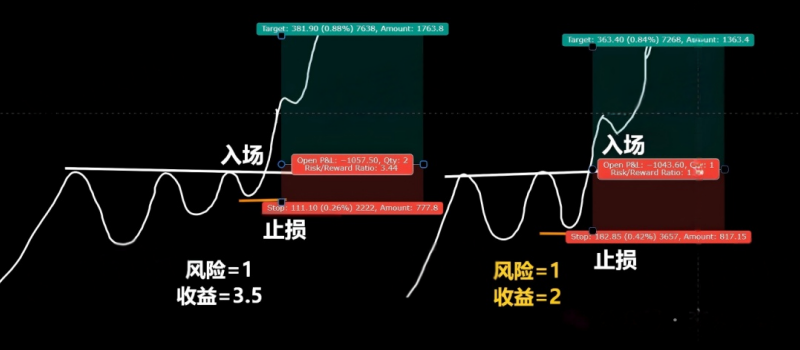
One major reason why the VCP strategy is favored by traders is its excellent risk-reward ratio, which can usually reach 3:1 or even higher.
By entering near key pivot points and placing stop losses below the last contraction, traders can often keep their risks within 5%–8%, while potential returns may reach 15% or even higher. This structure inherently favors 'tight stop losses, betting on trends.'
In practical operations, finding a perfect VCP chart is not that easy. The definition of VCP is relatively broad and abstract, and there are various variations, so the judgment is quite subjective. Different people may see completely different signals, unlike the simple and clear signals of moving average crossovers.
This is the trading experience that Yan An shared with everyone today. Often, you lose many opportunities to make money because of your doubts. If you do not dare to try boldly, to engage, to understand, how can you know the pros and cons? You only know what to do next after taking the first step. A cup of warm tea, a piece of advice; I am both a teacher and a talkative friend.
Fate brings us together, while understanding separates us. I firmly believe that fate brings us together over thousands of miles, while separation is destined. The path of investment is long; momentary gains and losses are merely the tip of the iceberg along the way. One must know that even the wisest can make mistakes, and the foolish may gain. Regardless of emotions, time will not stop for you. Pick up your worries and stand up again to move forward.
The secret techniques have been given to everyone; whether one can become famous in the martial arts world depends on oneself.
These methods should definitely be saved; many people may find them useful. You can share them with more cryptocurrency traders around you. Follow me to learn more valuable insights about the crypto world. After the rain, I am willing to hold an umbrella for the new traders! Follow me, and let's walk together on the path of cryptocurrencies!
