Eleven years is enough to turn an impulsive gambler into a restrained trader, transforming millions in debt into millions in wealth.
Some say the cryptocurrency market is a casino, and I admit it; but the true winners never rely on luck, but on the experience gained from failures, the systems built from hard work, and the mindset developed through perseverance.
Today, I share with you the blood, tears, successes, and failures of these ten years, breaking them down into stories and strategies, without reservation — may you take fewer detours than I did and grasp the essence of wealth more quickly.
In trading, people are obsessed with buying and selling at the ideal bottom/top. This mentality can easily lead traders to open positions too early or rush to take profits. So, is there a trading system that allows traders to make the right choices every time the market undergoes a significant reversal?
The Donchian Channels trading strategy is a technical analysis indicator invented by Richard Donchian, primarily used for trend-following trading.
The Tangchian Pass consists of three lines:
❍ Upper band: The highest price among the most recent N candlesticks.
❍ Lower band: The lowest price among the most recent N candlesticks.
❍ Middle rail: Average of the upper and lower rails
Based on the experience of many traders, the most commonly used and considered optimal Donchian Channel parameter is 20. Many traders view an upward breakout above the upper band or a downward breakout below the lower band as a trading signal worthy of action.
In this complete guide to the Donchian Passage, you will learn everything you need to know about this indicator.
There's a lot to cover, let's get started.
The History of the Original Donchian Pass – Richard Donchian
Before explaining how to apply the Donchian Channel to trading, let's briefly learn about its creator, Richard Donchian.

Richard Donchian, born in Connecticut in 1905, was a commodities and futures trader. He was a pioneer in managed futures and is considered by many to be the founder of the managed futures industry.
Donchian's parents were immigrants from Armenia who moved to the United States about 20 years before he was born. To make a living, they ran an Oriental carpet shop and had hoped that Richard would one day join the family business.
Nevertheless, Richard graduated from Yale University with a bachelor's degree in economics and later earned an MBA from MIT's Sloan School of Management. However, he ultimately couldn't completely detach himself from the family business and returned to the store as an assistant immediately after graduation.
It was during this period that Richard Donchian began to take an interest in the stock market. After reading Jesse Livermore's semi-autobiographical work (Memoirs of a Market Operator), he decided to try his hand at the financial markets himself. However, the market crash of 1929 caused him some losses, which ironically sparked his keen interest in technical analysis, hoping to use it to better analyze market prices.
In the early 1930s, he became the publisher of a well-known marketing service called Security Pilot, and later served as a securities analyst and account manager.
After completing his military service, Richard Donchian began his research, which eventually developed into the Donchian Channel as we know it today. He gradually shifted his focus to developing rule-based trading strategies and systems, leading to the later famous trend-following trading method.
In fact, Richard Donchian is widely recognized as the father of trend-following trading, and the Donchian Channel indicator is a direct manifestation of this idea.
Two interesting facts about Richard Donchian:
✔ Although Richard developed a strong interest in the market at a relatively young age, he did not make much money early in his trading career.
✔ He has been looking for a more conservative approach to trading in the crypto and stock markets, with low-volatility trades being particularly favored.
How is the Donchian Pass calculated?
Like other price channel indicators (such as Bollinger Bands and Kentner Channels), the Donchian Channel remains one of the most popular trading indicators. Despite this, its calculation method is very simple, yet extremely effective.
The Donchian Channel consists of three lines, as shown in the diagram below. The two outer lines represent the highest and lowest prices within the selected period, while the middle line is the average of the two.
Specifically as follows:
❍ Upper band: The highest price within the most recent N periods (K-line)
❍ Middle band: The average of the upper and lower bands
❍ Lower band: The lowest price in the most recent N periods
You can choose which parameter settings to use, but it should be noted that the optimal parameters will vary greatly depending on the time period and trading market.
However, the default parameter is 20 periods, which is the setting used by most investors and traders.
Nevertheless, it is still highly recommended to experiment with other parameter combinations. We ourselves rarely use the default timeframe in actual trading because, in many cases, other parameters tend to yield better results.
In the following sections of this article, we will discuss in detail how to choose the most suitable parameter settings.
How to use the Donchian Channel in trading?
The Donchian Channel has a wide range of uses depending on your trading style. Some strategies use the Donchian Channel to filter out poor-quality trading opportunities; others rely entirely on it as an entry trigger signal.
However, before we formally explain the two main trading approaches of the Donchian Channel, let’s look at a very important but often overlooked use: using the Donchian Channel to measure the level of market volatility.
Judging market volatility by channel width
Since the upper and lower rails of the Donchian Channel indicate the highest and lowest prices within the selected period, the distance between the two rails naturally becomes a way to measure the current market volatility.
This is particularly valuable when you need to define low-volatility or high-volatility environments in your trading strategy. You can also combine this method with the Donchian Channel application method, which will be introduced later in this article.
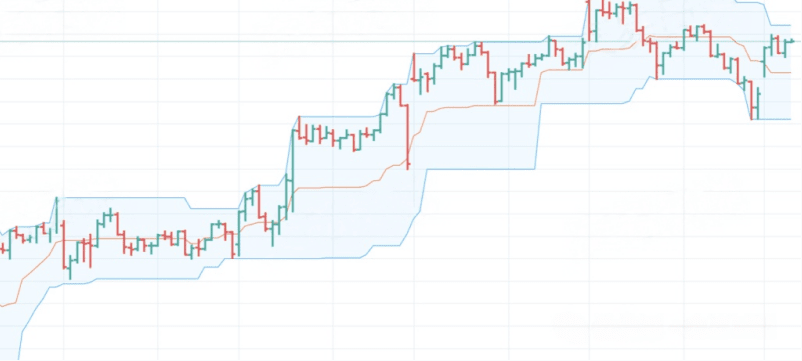
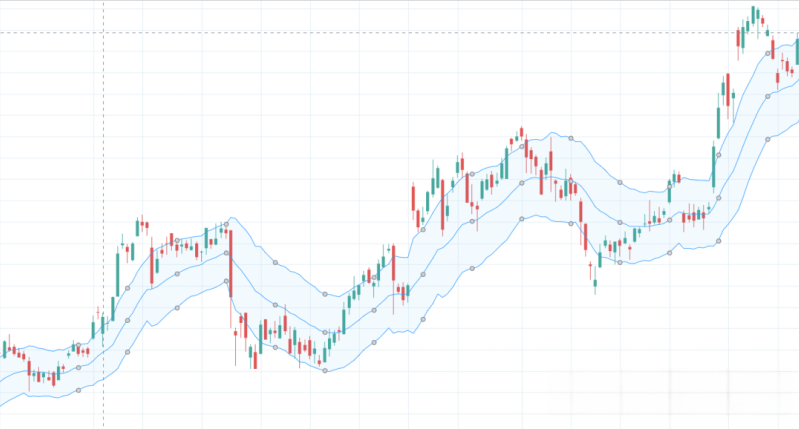
To make this more intuitive, we selected a 15-minute chart of the gold futures market to show how the channel width clearly reflects the current level of market volatility.
As you can see, the price increase in the middle of the chart has significantly widened the distance between the upper and lower rails of the channel compared to the period before the breakout.
In fact, the above scenario is a very common market structure that is closely watched by many traders and investors. When the distance between the upper and lower bands narrows, the market generally believes that the probability of a strong breakout in any direction is increasing.
After introducing how to use the Donchian Channel to measure market volatility, we will now delve into the two core trading ideas of mean reversion and trend following—which are the main applications of the Donchian Channel.
Trend following
As you know, trend following is a trading philosophy that attempts to capture market momentum by entering in the direction of the trend. Its core assumption is very simple: a market that already has momentum is more likely to continue moving in its current direction.
As you may recall, this is precisely the trading style employed by Richard Donchian himself, and the original intention behind his creation of the Donchian Channel. Therefore, combining the Donchian Channel with trend-following trading methods was the original design purpose of this indicator, and it remains in use by many traders today.
So, how do we confirm the entry signal?
The most common method is:
✔ A price breakout above the upper trendline is considered a bullish signal.
✔ A price drop below the lower trendline is considered a short entry signal.
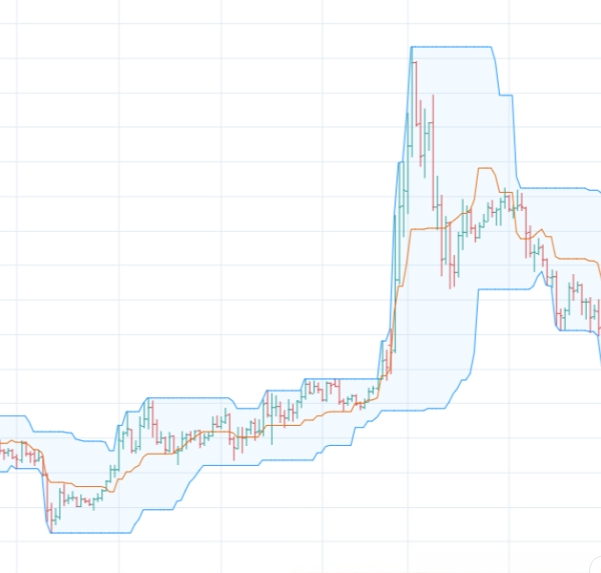
As shown in the image below:
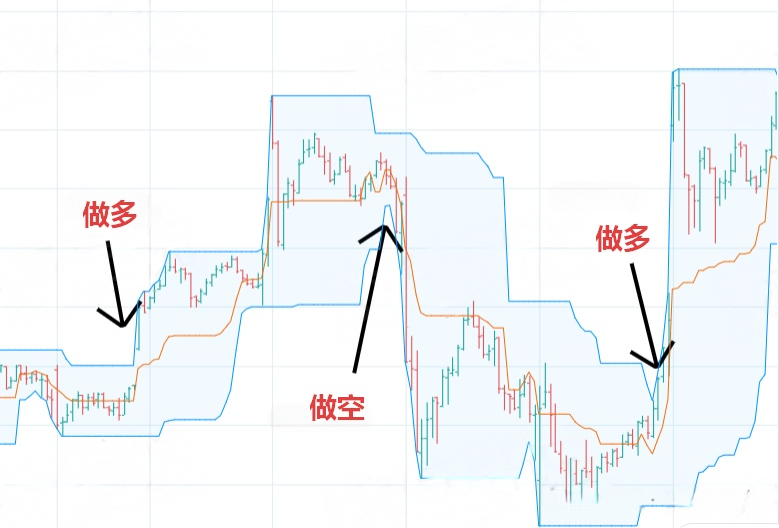
When interpreting the chart above, it is important to note that the price itself will never be "above" or "below" the Donchian Channel's trendline, as the channel is always automatically drawn at the highest and lowest price levels.
Therefore, when you see the upper band rise slightly, it actually means that the market has just formed a new high price; the logic behind the changes in the lower band is the same.
How to profit from breakout trading
After entering a trade following a breakout, there are several ways to exit. Below are three of the most common exit methods:
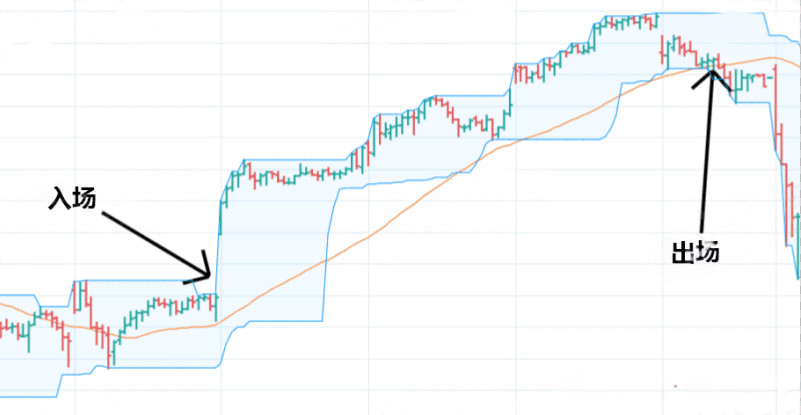
1. Trailing stop loss
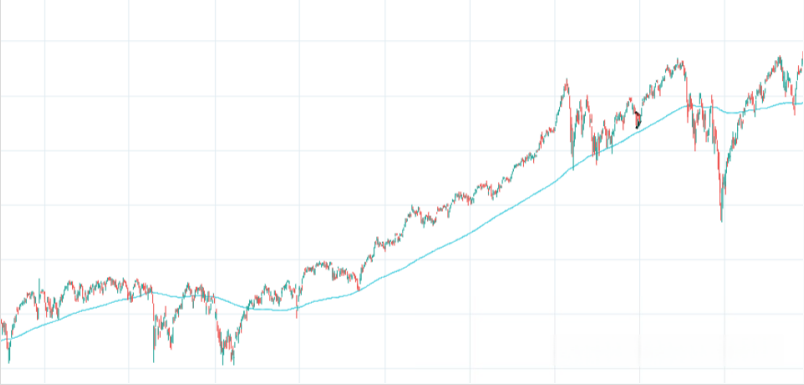
Some traders firmly believe that the best way to capture a breakout trend is to use a trailing stop-loss that follows the price movement. The goal of this approach is to stay in the trend for as long as possible, thereby capturing larger price swings.
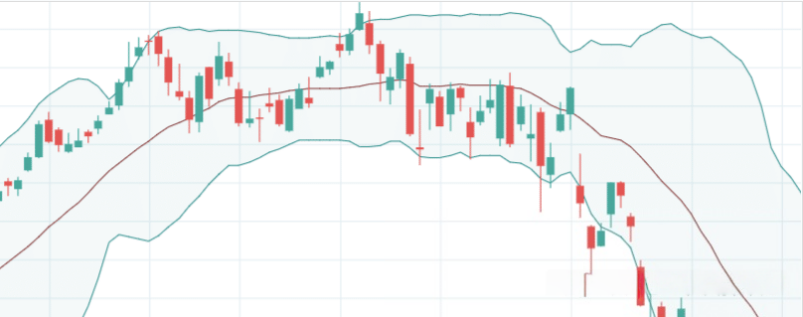
As you can see in the diagram below, after the price broke through the upper trendline, it began a relatively long-lasting trend. By using a trailing stop-loss order based on moving averages, we successfully held our position until the trend ended.
Scheduled appearance
You can also use this very simple exit method: exit after holding a fixed number of candlesticks. Although this method seems extremely rudimentary, it is exceptionally effective in certain market conditions.
Our suggestion is that you first calculate the average duration of trends in the target market, and then use that as a basis to determine when it is usually more reasonable to exit a trade.
This doesn't require precision down to the millimeter; the key is to have a general understanding of how long a market trend typically lasts.
Fixed stop loss + profit target
This is another common approach you can take. Simply put, you set both a stop-loss and a profit target at the same time, and the trade ends at whichever price level is triggered first.
One important point to remember here is that you should strive to achieve a risk-reward ratio greater than 1. This means that the potential profit of a trade should outweigh its potential loss.
For example, if a trade sets a profit target of $200 from the entry price and a stop loss of $100 below the entry price, then the risk-reward ratio of this trade is 2.
Conversely, if you take a $500 risk but only expect a $100 return, your risk-reward ratio is only 0.2, which is unacceptable for most trading strategies.
Is it feasible to trade using the original Donchian Channel for trend following?
The answer is that it is possible in certain markets. For example, in markets with strong trends, such as energy commodities, systems based on Donchian channel breakouts, as described above, have certain profit potential in the long run.
However, it's important to understand that this system alone is not an excellent trading system. It should be used in conjunction with other filtering conditions and auxiliary rules to effectively increase the probability of successful breakout trades.
However, in other markets such as stocks and equities, you might be better off using the Donchian Channel for mean reversion trading!
Mean Regression
Mean reversion refers to the characteristic that markets, after experiencing excessive volatility in a particular direction, tend to return to their "normal" level. This characteristic is particularly evident in stock and equity markets, but can also be observed in other markets.
When the market moves too far in a downtrend, it is generally considered oversold; when the market moves too far in an uptrend, it is considered overbought.
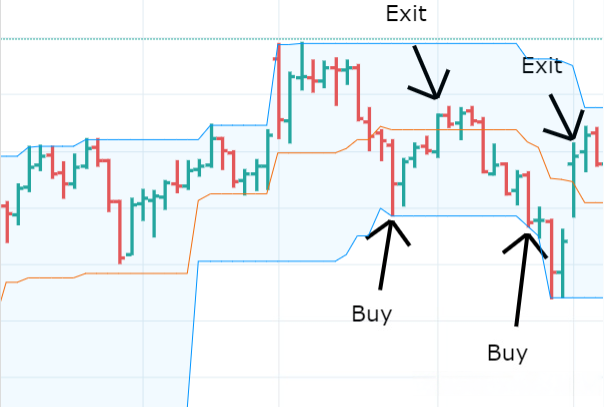
When using the Donchian Channel for mean reversion trading, we employ rules completely opposite to trend following. That is, a price breakout above the previous high is considered a short signal; a price breakout below the previous low is considered a long signal.
In the example chart below, we go long when the market makes a new 20-candle low, and close the position when the price crosses above the middle band. This is a very common trading strategy, and many traders use similar approaches in different ways.
At this point, you might wonder: since the previous text mentioned that the contrarian rule is profitable in trend following, why does "reversing" work here as well?
The answer is simple: it all depends on the market you're trading, the time frame, and your specific strategy.
In some markets, mean reversion works better; while in others, only trend-following strategies are effective.
How to exit mean reversion trading based on the Donchian Channel
The exit strategy for mean reversion trades differs slightly from that of trend-following strategies.
Generally speaking, in mean reversion strategies, the more the market moves against you, the greater the strategy's "advantage" becomes. This is why you don't want to cut your losses too early. Frankly, when the market is clearly moving against you, the probability of a reversal is actually higher.
Nevertheless, we still strongly recommend that you set a stop-loss order, but make sure it's positioned far enough away. Otherwise, you'll be frequently stopped out, severely limiting the overall profitability of your strategy.
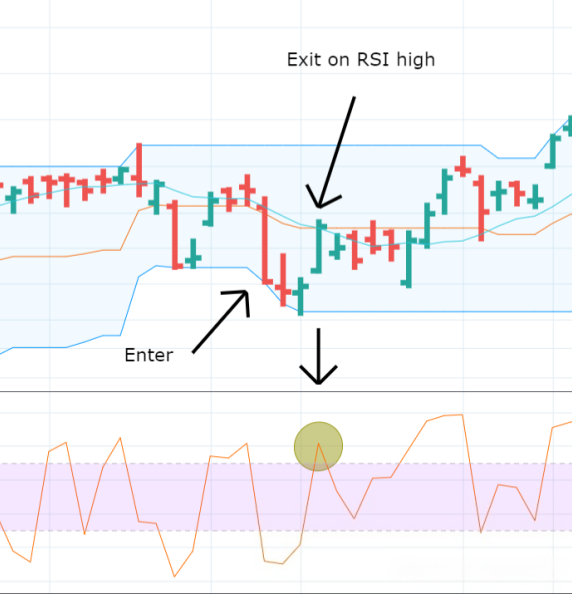
Regarding profit-taking mechanisms, we suggest using certain conditions to determine whether the market is no longer oversold. This condition can be defined as the price closing above the middle band (as mentioned above), or by using momentum indicators such as the Relative Strength Index (RSI).
One of our preferred exit strategies, based on mean reversion, is to wait for the short-term RSI to cross above a certain high threshold before exiting the position. This method has performed well over the years, and we believe you will frequently use it in practice.
Pay attention to the trend!
When using the Donchian Channel for mean reversion trading, it is a very good habit to always pay attention to the overall trend direction.
The reason is actually very simple.
Markets in a downtrend are more likely to continue hitting new lows; while markets in an uptrend are more likely to reverse.
This means that a new 20-period low formed in a bull market is more likely to trigger a rebound than a new low formed in a bear market.
Therefore, we recommend using the 200-period moving average (MA-200) as a trend filter to identify the long-term market environment. Mean reversion trading should only be considered when the market price is trading above the MA-200.
Optimal parameter settings for the Donchian Channel
Based on the experience of many traders, the most commonly used Donchian Channel parameter is 20.
Upon closer examination, this actually makes sense, because a trading month has a cycle of slightly more than 20 trading days.
However, this does not mean you should stick to the default parameters.
On the contrary, we always recommend that you experiment to find the parameter settings that best suit your trading market and time frame.
We certainly hope to tell you "a certain parameter is optimal", but in reality, that's simply impossible.
Every market has its own "personality," and its reactions to different indicators and parameters vary. Therefore, you must test and observe how your market, cycle, and strategy perform under different parameters.
The most effective method is backtesting, which involves using software to simulate trading based on historical data.
Donchian Channel Trading Strategy
Having gained a deeper understanding of how the Donchian Channel works, it's time to introduce some trading strategies that are more common among traders.
It is particularly important to emphasize that any strategy must be validated before it is put into live trading.
You can never predict in advance how the market and cycles will react; a strategy that works in one market may fail completely in another.
Nevertheless, we still believe the following strategies are excellent sources of inspiration.
If you ask us, "How would you build a trading strategy using the Donchian Channel from scratch?"
The answer is that we will definitely try these approaches.
So let's look at them one by one.
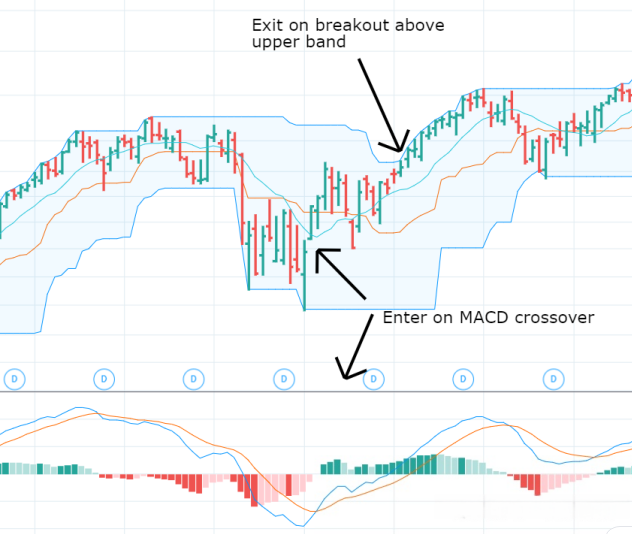
1. Original Donchian Channel + MACD Strategy
In this strategy, we attempt to combine the MACD indicator with the original Donchian Channel to find opportunities where both point to a potential market rise or fall.
More specifically, this is a mean-reverting strategy that aims to profit when the market is oversold.
✍ When the MACD shows a positive golden cross and is close to the lower rail, look for opportunities to go long;
✍ Exit the trade when a death cross appears on the MACD.
The entry rules for this strategy are as follows:
1. The market has broken down through the lower Donchian trendline, or a similar breakout may have occurred recently.
2. The appearance of a MACD golden cross indicates that the possibility of a trend reversal is increasing.
Playing Rules:
1. Wait for the MACD death cross to appear, which indicates that the market trend has ended.
2. Alternatively, exit when the price rises and breaks through the Donchian upper rail.
In the example below, you can see that when the market recently broke below the lower band, we bought when a MACD golden cross appeared; subsequently, the price continued to rise, and when the upper band was broken, we immediately sold to close the position.
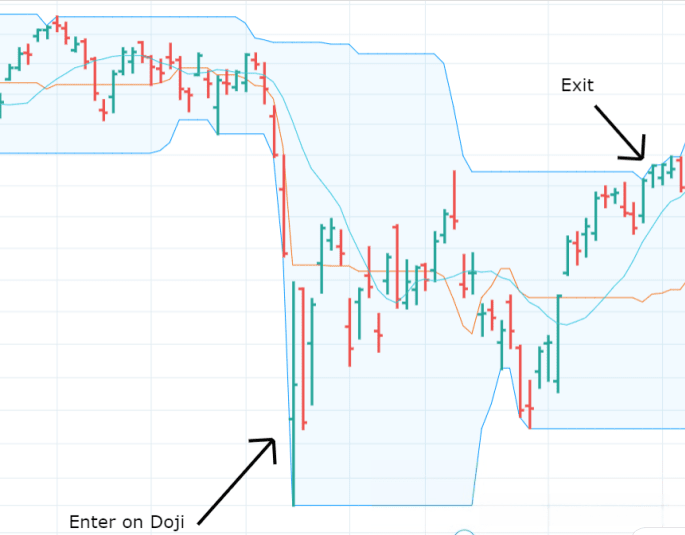
Donchian Passage and Cross
In this trading strategy, we will use the Doji candlestick pattern. The Doji usually represents a state of hesitation and uncertainty in the market, so it can help us to mark entry opportunities when the market has over-moved downwards and is likely to revert to the mean.
The definition of a doji is very simple: a candlestick whose opening price and closing price are roughly the same.
In this strategy, the buy condition is that the market falls below the lowest price formed by the doji candlestick, or a doji candlestick appears immediately after the price falls below the low. Similar to the previous strategy, we exit immediately when the price touches the upper Donch line.
In the example below, you can see that after the price broke below the lower Bollinger Band, a doji candlestick pattern formed immediately.
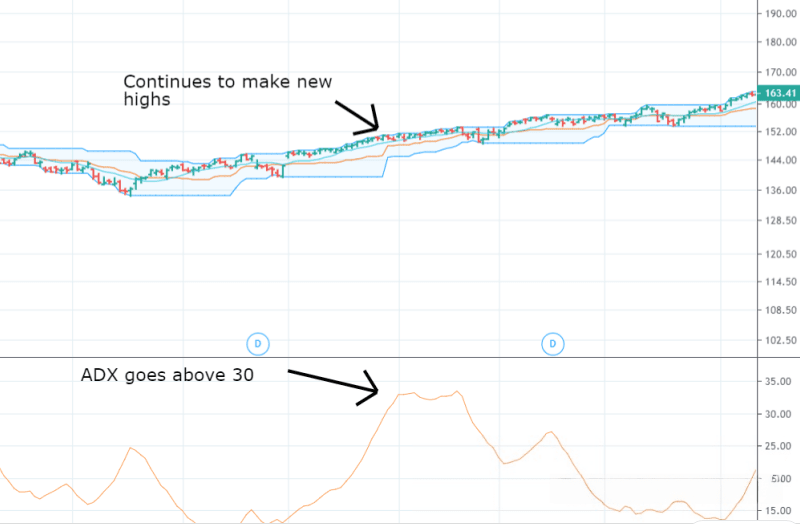
Donchian Passage and ADX
After introducing a mean reversion strategy, we will now demonstrate a trend-following breakout strategy, which is exactly how the Donchian Channel was designed to be used, as its inventor intended.
The core rule of this strategy is that you can only go long when the price breaks through the highest point of the upper band; and you can only go short when the price breaks through the lowest point of the lower band.
However, as we discussed earlier, such breakout entries are highly susceptible to false breakouts. To mitigate this risk, we need to add a filtering condition.
One filtering method we really like to use is to use the ADX indicator to determine whether the market has enough momentum to make a breakout more likely to continue.
The specific rule is that long positions are only allowed when the ADX is above 30. Theoretically, this means that the market has sufficiently strong trend power when it approaches and breaks through the upper rail, making it more likely to continue moving in the direction of the breakout.
The rules of this strategy are summarized as follows:
✍ Price breaks upward through the Donchian upper rail.
✍ ADX value higher than 30
Use the trailing stop method described earlier to trade with the trend for as long as possible.
Donchian Passage vs Kentner Passage
The Keltner Channel is another common price channel indicator.
The Kentner Channel also consists of three lines, and its calculation method is as follows:
✍ Middle Band: Exponential Moving Average (EMA)
✍ Upper and lower bands: located above and below the EMA, at a distance of 2 × Mean True Range (ATR).
As can be seen, this is significantly different from the Donchian Channel: the Donchian Channel draws its upper and lower rails entirely based on the highest and lowest prices within the period, without involving moving averages or volatility calculations.
Nevertheless, these two indicators can serve similar functions in trading strategies, but the actual trading results may differ significantly.
Donchian Channel vs Bollinger Bands
Bollinger Bands are another price channel indicator that is more popular than the Kentner Channel. In fact, it is very similar to the Kentner Channel in structure, but there is a key difference.
Similar to the Kentner Channel, the middle band of the Bollinger Bands is also an exponential moving average.
The difference lies in the fact that the upper and lower bands are not based on the ATR, but are set at a distance of twice the closing price standard deviation from the moving average. This makes the Bollinger Bands reflect the degree of price dispersion relative to the mean, rather than the actual price range.
Compared to the Donchian Channel, Bollinger Bands can be understood as being touched less frequently. Aside from that, they are quite similar in their usage.
Summarize
The Donchian Channels indicator, created by Richard Donchian, is a classic tool that every trader should know. Despite its extremely simple structure, it provides great assistance in both trend-following and mean-reversion trading.
Please remember that there is no need to stick to the default parameter settings. We ourselves rarely do this in trading; instead, we use backtesting to find the parameter combinations that have performed best historically.
Below are some excellent reference materials on the Donchian Channel trading strategy for further study:
Finally, backtesting is crucial in validating the Donchian Channel trading strategy. By simulating historical data, it assesses the strategy's potential performance in the past, helping traders better understand the strategy's potential risk and reward structure before live trading.
The above is the trading experience that Yan'an shared with you today. Many times, you miss out on many money-making opportunities because of your doubts. If you don't dare to try, explore, and understand, how will you know the advantages and disadvantages? Only by taking the first step will you know what to do next. With a cup of warm tea and a word of advice, I am both a teacher and a good friend to you.
Meeting is fate, understanding is destiny. I firmly believe that those destined to meet will eventually meet, even from afar; those not destined will simply pass each other by. The road of investment is long, and temporary gains or losses are merely the tip of the iceberg. Remember, even the wisest can make a mistake, and even the most cunning can have a stroke of genius. No matter your emotions, time will not stand still for you. Pick yourself up from your troubles, stand up again, and move forward with renewed vigor.
The martial arts manual has been given to you all; whether you can become famous in the martial arts world depends on yourselves.
Be sure to save these methods and share them widely. If you find them useful, please forward them to other cryptocurrency traders. Follow me to learn more about the crypto world. I'm here to help those who are just getting wet in the rain! Follow me, and let's walk the crypto path together!
