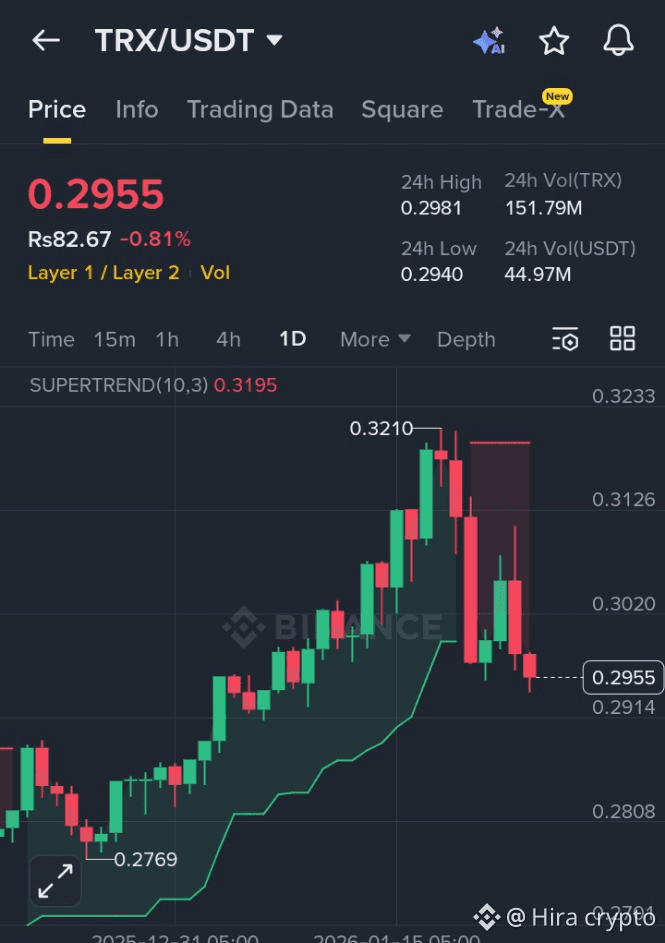
$TRX currently forms a descending flag, indicating the continuation of the recent downtrend. 📉🔻 After a strong sell-off, prices are consolidating within a narrow range, but buyers remain weak while sellers dominate, making the preferred strategy to short now.
From a technical perspective, TRX is printing lower highs and lower lows within the flag structure. Volume confirms the downtrend: it decreases on minor rallies and increases on downward moves, indicating strong selling dominance. ⚠️📊 Tokens like SENT and DUSK also reflect weakness, reinforcing the bearish market environment, while sentiment-driven assets like TRUMP typically follow broader market declines. 🪙📉
The market structure favors short positions. Any bounce towards the upper boundary of the flag is likely to be sold aggressively, maintaining downward pressure. TRX is ideal for selling strategies on the rise, with the possibility of further decline if the flag breaks down decisively.
The broader market correlation supports the bearish case. Assets like ZEC and ZEN often experience delayed continuation moves, while XNY, PIPPIN, and BEAT accelerate downward during bearish phases. Ecosystem-focused tokens like POWER and RIVERS also lose momentum, reinforcing the bearish setup for TRX. 💵📊
For traders, optimal short entry points are near the resistance of the flag or upon a confirmed breakdown below support. Maintaining positions as long as TRX stays below the flag keeps the risk-reward ratio favorable. Slight upticks are expected to be sold.
Risk management is crucial. The bearish flag is only invalidated if TRX breaks above the upper boundary of the flag with strong buying volume. Until then, the odds favor continued decline. Historically, bearish flags often lead to accelerated selling once a breakdown occurs.
#TRX #GrayscaleBNBETFFiling #USIranMarketImpact #ETHMarketWatch #WEFDavos2026