They focus on defending critical support levels and overcoming short-term resistances to confirm a trend change.
Market Scenario for today January 23
Current Price: It is trading near $68.43 USD, maintaining a market sentiment of "Extreme Fear" (index 24/100).
Daily Range: LTC is expected to fluctuate today between $68.43 and $70.91 USD.
Trading Recommendations
Critical Support ($74.66 - $79.90): Although the current price is lower, analysts consider the area of $74.66 USD as a key invalidation level for any short-term bullish scenario.
Conservative Strategy: Wait for a decisive breakout above $82.07 USD with volume confirmation before entering long positions (buys).
Aggressive Strategy: Consider accumulating near the support level of $79.94 USD, using a strict Stop-Loss below $79.00 USD to mitigate the risk of further decline.
Resistance to Overcome: The first significant barrier is at $83.22 USD. Overcoming this level could catalyze a recovery towards the range of $87 - $95 USD by the end of the month.
The analysis of technical indicators for Litecoin (LTC) this Friday, January 23, 2026, shows a mixed signal with a slight inclination towards recovery, driven by a nascent bullish divergence in the MACD despite the current price of approximately $68.43 USD.
1. MACD Indicator (Moving Average Convergence/Divergence)
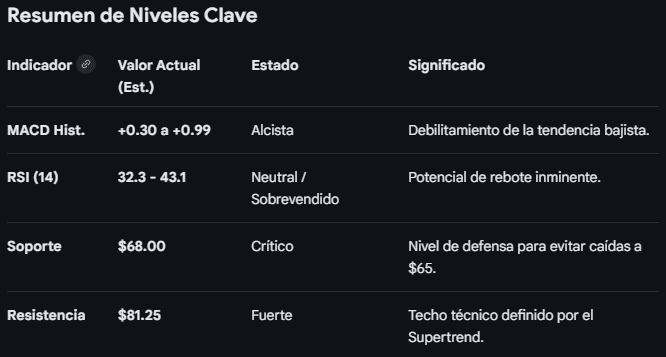
Positive Histogram: The histogram has begun to turn positive (recording readings from 0.3048 to 0.9946 according to the platform), indicating that bearish momentum is losing strength and a potential upward reversal may be forming.
Confirmation Signal: Analysts expect the MACD line to cross above its signal line to confirm a safe entry; this event typically precedes recoveries towards the projected range of $87 - $95 USD by the end of January.
2. RSI Indicator (Relative Strength Index)
Neutral Zone to Oversold: The 14-day RSI is between 32.3 and 43.1, depending on the analyzed time frame. A reading close to 32 suggests that the asset is nearing oversold conditions, which historically limits further declines and favors technical bounces.
Upward Margin: Being below 50, the RSI indicates that there is still no clear buying dominance, but it offers ample "room" to rise before reaching overbought levels (70+).
Follow me and like. Thank you.


