 Bitcoin has retraced to the 92,600 USD zone, a level that acts as macro support and coincides with the 61.8% Fibonacci retracement of the last impulsive move. Although the asset has temporarily lost its 50-period moving average on the weekly chart —a warning sign for bulls— it has managed to recover and consolidate above this same average on the daily timeframe. This discrepancy between timeframes reflects the current indecision of the market.
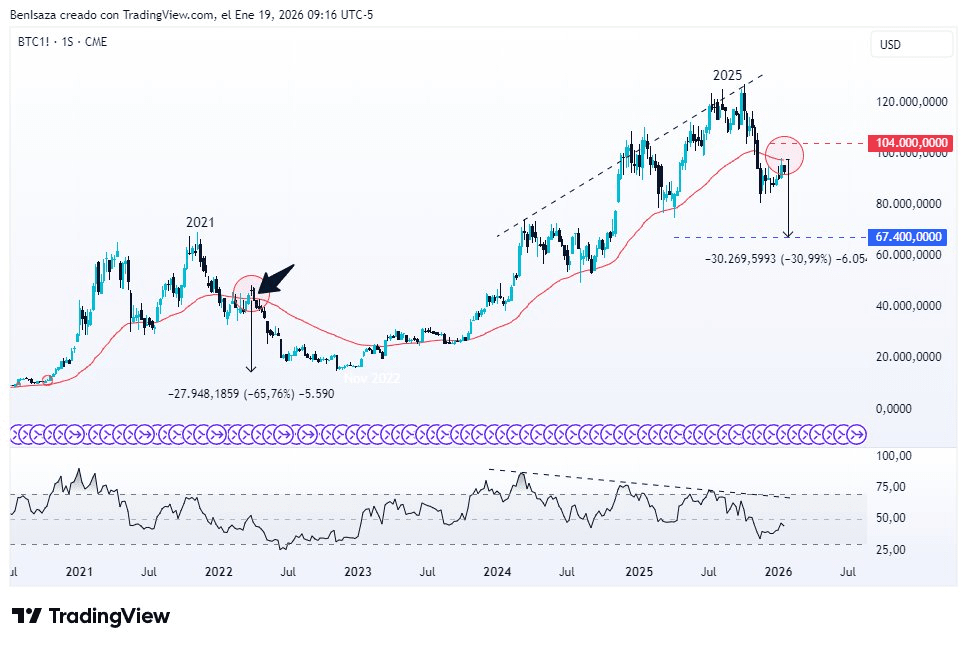
The base scenario maintains a conditional bullish bias. The key lies in the price successfully defending the 92,000 – 92,600 USD region. If achieved, the structure suggests a technical target towards the psychological barrier of 104,000 USD, a level that acted as a rejection point in a similar structure in early 2022.
However, the analysis presents two caution signals. First, a notable bearish divergence is observed between the maximum price of 2024 and the RSI (Relative Strength Index), which technically anticipated this pullback. Second, the RSI currently remains below the 50 level on daily and weekly charts, confirming that the immediate momentum is still controlled by sellers. A decisive break and a weekly close below 92,000 USD would invalidate the short-term bullish outlook and could trigger a deeper correction towards the main support at 67,400 USD, completing a larger-scale distribution pattern.
